# Technical Document Extraction: Bar Chart Analysis
## Chart Overview
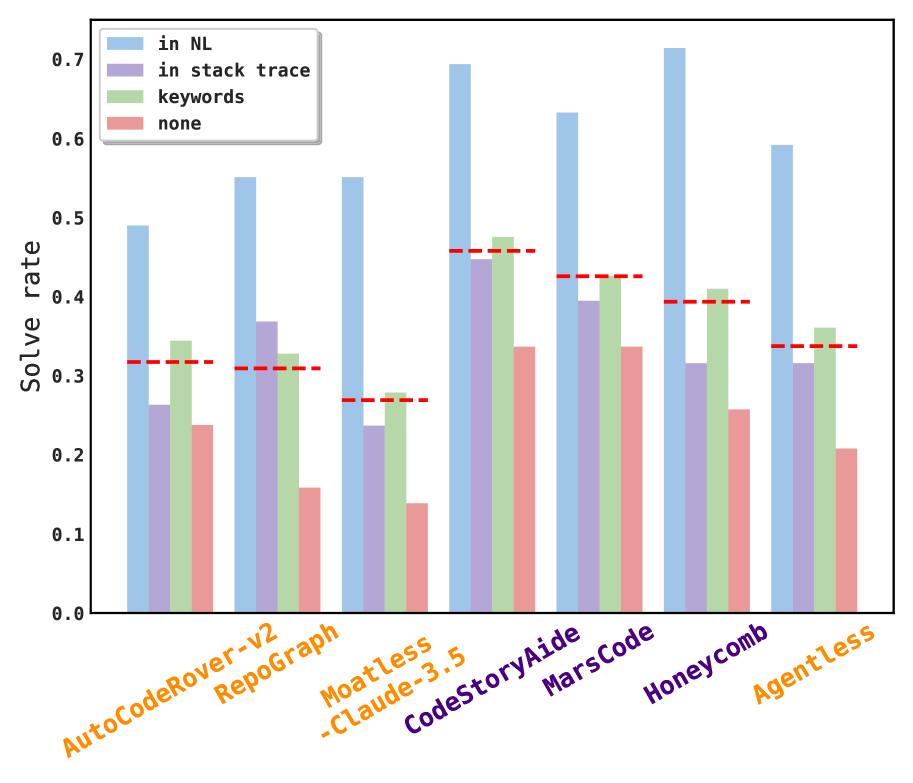
The image is a grouped bar chart comparing **solve rates** across seven software tools, with four categorical groupings represented by color-coded bars. The chart includes a red dashed threshold line at **0.3 solve rate**.
---
## Axis Labels and Markers
- **X-axis**: Tools (categories)
- AutoCodeRover-v2
- RepoGraph
- Moatless-Claude-3.5
- CodeStoryAide
- MarsCode
- Honeycomb
- Agentless
- **Y-axis**: Solve rate (0.0 to 0.7, increments of 0.1)
- **Legend**:
- `in NL` (blue)
- `in stack trace` (purple)
- `keywords` (green)
- `none` (red)
- **Threshold Line**: Red dashed line at **0.3 solve rate**
---
## Key Trends and Data Points
1. **Highest Solve Rate**:
- The `in NL` category (blue) consistently achieves the highest solve rates across all tools, exceeding **0.5** in all cases.
- **Peak**: Honeycomb (`in NL`) reaches **~0.7**, the highest value in the chart.
2. **Second-Highest Solve Rate**:
- The `keywords` category (green) is the second-highest, with values ranging from **~0.32 to ~0.48**.
- **Peak**: CodeStoryAide (`keywords`) at **~0.48**.
3. **Third-Highest Solve Rate**:
- The `in stack trace` category (purple) ranges from **~0.23 to ~0.45**.
- **Peak**: CodeStoryAide (`in stack trace`) at **~0.45**.
4. **Lowest Solve Rate**:
- The `none` category (red) is consistently the lowest, with values ranging from **~0.14 to ~0.34**.
- **Peak**: CodeStoryAide (`none`) at **~0.34** (only category above the 0.3 threshold).
5. **Threshold Analysis**:
- The red dashed line at **0.3** serves as a benchmark.
- **Observations**:
- All `in NL` bars exceed the threshold.
- `keywords` bars are above the threshold in all cases except RepoGraph (~0.32, marginally above).
- `in stack trace` and `none` categories are mostly below the threshold, except for CodeStoryAide (`none` at ~0.34).
---
## Tool-Specific Observations
| Tool | in NL (~Solve Rate) | in stack trace (~Solve Rate) | keywords (~Solve Rate) | none (~Solve Rate) |
|-----------------------|---------------------|------------------------------|------------------------|--------------------|
| AutoCodeRover-v2 | ~0.5 | ~0.25 | ~0.35 | ~0.23 |
| RepoGraph | ~0.55 | ~0.37 | ~0.32 | ~0.16 |
| Moatless-Claude-3.5 | ~0.55 | ~0.23 | ~0.28 | ~0.14 |
| CodeStoryAide | ~0.63 | ~0.45 | ~0.48 | ~0.34 |
| MarsCode | ~0.65 | ~0.40 | ~0.42 | ~0.33 |
| Honeycomb | ~0.7 | ~0.32 | ~0.40 | ~0.26 |
| Agentless | ~0.6 | ~0.32 | ~0.36 | ~0.21 |
---
## Conclusion
The chart demonstrates that **`in NL`** is the most effective category for solving issues across all tools, while **`none`** performs the worst. The `keywords` category shows moderate effectiveness, and **`in stack trace`** has variable performance. The red threshold line highlights that only `in NL` and select `keywords` cases consistently meet or exceed the 0.3 solve rate benchmark.