\n
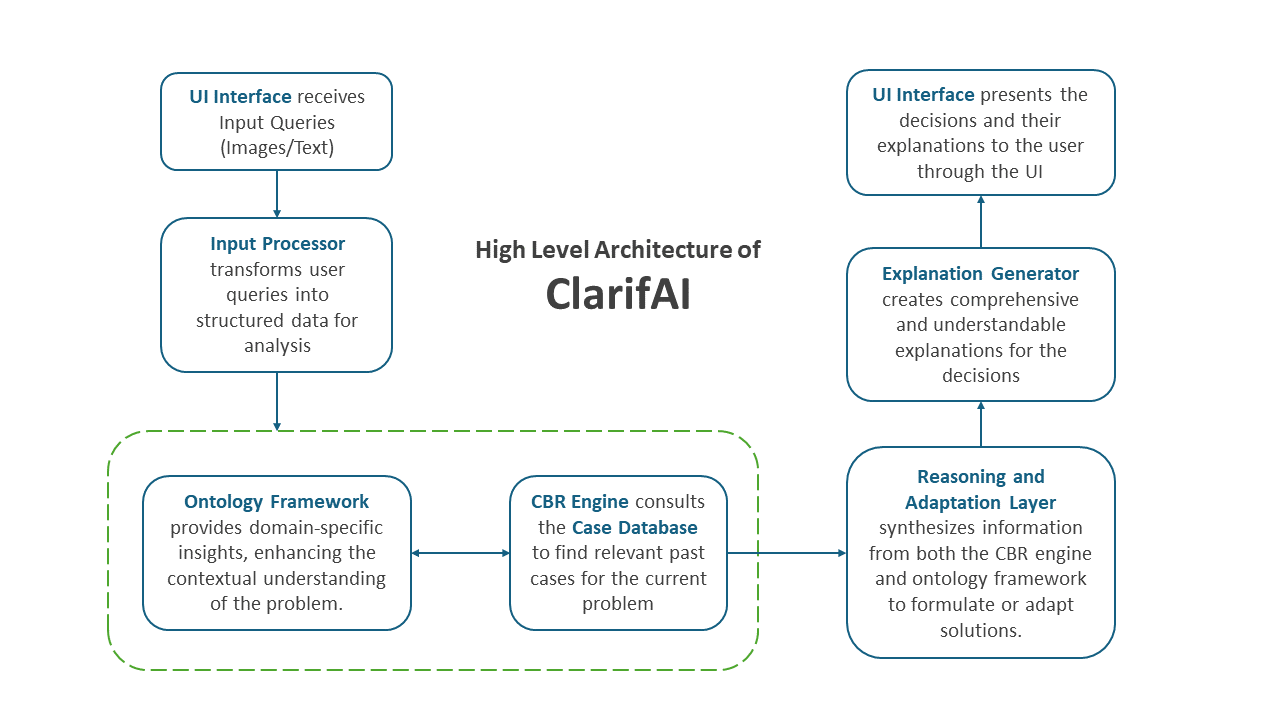
## Diagram: High Level Architecture of ClarifAI
### Overview
The image is a diagram illustrating the high-level architecture of a system called ClarifAI. It depicts a process flow with several interconnected components, arranged in a roughly circular manner. The diagram uses boxes to represent components and arrows to indicate the flow of information.
### Components/Axes
The diagram consists of the following components:
* **UI Interface (Top-Left):** Receives Input Queries (Images/Text).
* **Input Processor (Left):** Transforms user queries into structured data for analysis.
* **High Level Architecture of ClarifAI (Center):** This is the title of the diagram.
* **Explanation Generator (Right):** Creates comprehensive and understandable explanations for the decisions.
* **UI Interface (Top-Right):** Presents the decisions and their explanations to the user through the UI.
* **Ontology Framework (Bottom-Left):** Provides domain-specific insights, enhancing the contextual understanding of the problem.
* **CBR Engine (Bottom-Center):** Consults the Case Database to find relevant past cases for the current problem.
* **Reasoning and Adaptation Layer (Bottom-Right):** Synthesizes information from both the CBR engine and ontology framework to formulate or adapt solutions.
The diagram uses arrows to show the flow of information between these components. A green dashed line surrounds the Ontology Framework, CBR Engine, and Reasoning and Adaptation Layer.
### Detailed Analysis or Content Details
The diagram illustrates a cyclical process:
1. The **UI Interface** receives input queries (images or text).
2. The **Input Processor** transforms these queries into structured data.
3. The structured data is then used by the **Ontology Framework** and **CBR Engine**.
4. The **Reasoning and Adaptation Layer** synthesizes information from both the **CBR Engine** and **Ontology Framework**.
5. The **Explanation Generator** creates explanations based on the synthesized information.
6. Finally, the **UI Interface** presents the decisions and explanations to the user.
The green dashed line highlights a core processing loop involving the Ontology Framework, CBR Engine, and Reasoning and Adaptation Layer.
### Key Observations
The diagram emphasizes the integration of case-based reasoning (CBR) with an ontology framework for enhanced decision-making and explanation generation. The UI plays a crucial role in both input and output. The architecture appears to be designed for systems requiring explainable AI (XAI).
### Interpretation
The diagram represents a system designed for intelligent decision-making with a strong emphasis on explainability. The use of an ontology framework suggests the system leverages domain knowledge to improve the accuracy and relevance of its reasoning. The CBR engine allows the system to learn from past experiences and apply that knowledge to new problems. The Reasoning and Adaptation Layer acts as a central hub, integrating information from both the ontology and the CBR engine to formulate solutions. The entire process is user-centric, with the UI serving as the primary interface for both input and output. The green dashed line suggests a core, iterative process of knowledge application and refinement. The architecture is likely intended for complex problem-solving scenarios where understanding *why* a decision was made is as important as the decision itself.