## Scatter Plot: Feasible Region
### Overview
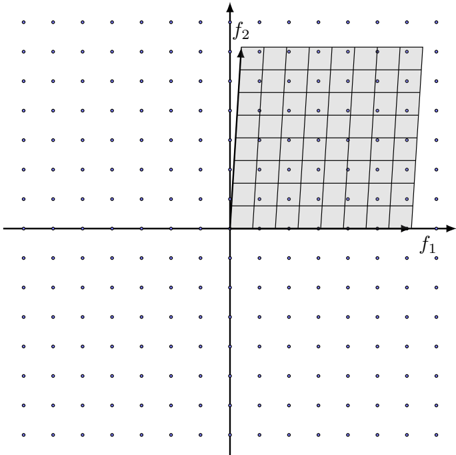
The image is a scatter plot on a 2D plane, with axes labeled f1 and f2. The plot shows a grid of points, with a shaded region in the upper-right quadrant. The shaded region is a parallelogram, indicating a feasible region.
### Components/Axes
* **X-axis:** Labeled "f1" with an arrow indicating positive direction.
* **Y-axis:** Labeled "f2" with an arrow indicating positive direction.
* **Grid:** A grid of points is present, extending across the entire plot.
* **Shaded Region:** A parallelogram-shaped region is shaded in gray in the first quadrant. The vertices of the parallelogram appear to be at approximately (0, 2), (5, 0), (5, 5), and (0, 7).
### Detailed Analysis
* The grid points are evenly spaced.
* The shaded region is bounded by straight lines.
* The origin (0,0) is located at the intersection of the f1 and f2 axes.
* The grid points within the shaded region are also visible.
### Key Observations
* The shaded region represents a feasible region in the f1-f2 space.
* The grid points likely represent discrete values for f1 and f2.
* The parallelogram shape suggests linear constraints on f1 and f2.
### Interpretation
The plot likely represents a feasible region for a linear programming problem or a similar optimization problem. The variables f1 and f2 are constrained such that only the points within the shaded parallelogram are valid solutions. The grid points suggest that f1 and f2 can only take on discrete values. The shape and location of the feasible region are determined by the constraints of the problem.