TECHNICAL ASSET FINGERPRINT
303022b80a688fb9210f370b
Click to view fullscreen
Press ESC or click to close
FOUND IN PAPERS
EXPERT: gemma-3-27b-it-free VERSION 1
RUNTIME: google-free/gemma-3-27b-it
INTEL_VERIFIED
\n
## Scatter Plot: Performance Comparison of Large Language Models
### Overview
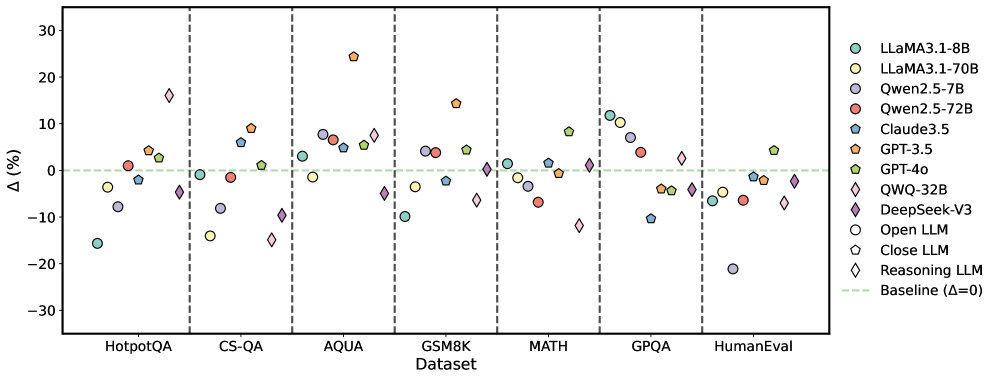
This image presents a scatter plot comparing the performance of several Large Language Models (LLMs) across seven different datasets. The y-axis represents the percentage difference (Δ (%)) in performance relative to a baseline, and the x-axis lists the datasets used for evaluation. The plot uses different colors and markers to distinguish between the various LLMs. Vertical dashed lines separate each dataset.
### Components/Axes
* **X-axis:** Dataset - labeled with the following datasets: HotpotQA, CS-QA, AQUA, GSM8K, MATH, GPQA, and HumanEval.
* **Y-axis:** Δ (%) - Represents the percentage difference in performance compared to a baseline (Δ=0). The scale ranges from approximately -30% to 30%.
* **Legend (Top-Right):** Contains labels and corresponding colors/markers for each LLM:
* LLaMA3.1-8B (Light Blue Circle)
* LLaMA3.1-70B (Light Green Circle)
* Qwen.2.5-7B (Light Purple Circle)
* Qwen.2.5-72B (Red Circle)
* Claude3.5 (Dark Blue Triangle)
* GPT-3.5 (Orange Triangle)
* GPT-4.0 (Dark Green Triangle)
* QWQ-32B (Dark Purple Diamond)
* DeepSeek-V3 (Pink Diamond)
* Open LLM (Black Hexagon)
* Close LLM (Gray Hexagon)
* Reasoning LLM (White Diamond)
* Baseline (Δ=0) (Horizontal Dashed Red Line)
### Detailed Analysis
The data points are scattered across the plot, indicating varying performance levels for each LLM on each dataset. The baseline is represented by a horizontal dashed red line at Δ=0.
* **HotpotQA:**
* LLaMA3.1-8B: Approximately +5% to +15%
* LLaMA3.1-70B: Approximately +5% to +10%
* Qwen.2.5-7B: Approximately -5% to +10%
* Qwen.2.5-72B: Approximately -5% to +5%
* Claude3.5: Approximately -10% to +5%
* GPT-3.5: Approximately +5% to +15%
* GPT-4.0: Approximately +5% to +10%
* QWQ-32B: Approximately -5% to +5%
* DeepSeek-V3: Approximately -10% to +10%
* Open LLM: Approximately -10% to +5%
* Close LLM: Approximately -10% to +5%
* Reasoning LLM: Approximately -10% to +5%
* **CS-QA:**
* LLaMA3.1-8B: Approximately -10% to +10%
* LLaMA3.1-70B: Approximately -10% to +10%
* Qwen.2.5-7B: Approximately -10% to +10%
* Qwen.2.5-72B: Approximately -10% to +10%
* Claude3.5: Approximately -10% to +5%
* GPT-3.5: Approximately -10% to +5%
* GPT-4.0: Approximately -10% to +5%
* QWQ-32B: Approximately -10% to +5%
* DeepSeek-V3: Approximately -10% to +5%
* Open LLM: Approximately -10% to +5%
* Close LLM: Approximately -10% to +5%
* Reasoning LLM: Approximately -10% to +5%
* **AQUA:**
* LLaMA3.1-8B: Approximately -10% to +10%
* LLaMA3.1-70B: Approximately -10% to +10%
* Qwen.2.5-7B: Approximately -10% to +10%
* Qwen.2.5-72B: Approximately -10% to +10%
* Claude3.5: Approximately -10% to +5%
* GPT-3.5: Approximately -10% to +5%
* GPT-4.0: Approximately -10% to +5%
* QWQ-32B: Approximately -10% to +5%
* DeepSeek-V3: Approximately -10% to +5%
* Open LLM: Approximately -10% to +5%
* Close LLM: Approximately -10% to +5%
* Reasoning LLM: Approximately -10% to +5%
* **GSM8K:**
* LLaMA3.1-8B: Approximately -10% to +20%
* LLaMA3.1-70B: Approximately -10% to +10%
* Qwen.2.5-7B: Approximately -10% to +10%
* Qwen.2.5-72B: Approximately -10% to +10%
* Claude3.5: Approximately -10% to +5%
* GPT-3.5: Approximately -10% to +5%
* GPT-4.0: Approximately -10% to +5%
* QWQ-32B: Approximately -10% to +5%
* DeepSeek-V3: Approximately -10% to +5%
* Open LLM: Approximately -10% to +5%
* Close LLM: Approximately -10% to +5%
* Reasoning LLM: Approximately -10% to +5%
* **MATH:**
* LLaMA3.1-8B: Approximately -20% to +10%
* LLaMA3.1-70B: Approximately -20% to +10%
* Qwen.2.5-7B: Approximately -20% to +10%
* Qwen.2.5-72B: Approximately -20% to +10%
* Claude3.5: Approximately -20% to +5%
* GPT-3.5: Approximately -20% to +5%
* GPT-4.0: Approximately -20% to +5%
* QWQ-32B: Approximately -20% to +5%
* DeepSeek-V3: Approximately -20% to +5%
* Open LLM: Approximately -20% to +5%
* Close LLM: Approximately -20% to +5%
* Reasoning LLM: Approximately -20% to +5%
* **GPQA:**
* LLaMA3.1-8B: Approximately -10% to +10%
* LLaMA3.1-70B: Approximately -10% to +10%
* Qwen.2.5-7B: Approximately -10% to +10%
* Qwen.2.5-72B: Approximately -10% to +10%
* Claude3.5: Approximately -10% to +5%
* GPT-3.5: Approximately -10% to +5%
* GPT-4.0: Approximately -10% to +5%
* QWQ-32B: Approximately -10% to +5%
* DeepSeek-V3: Approximately -10% to +5%
* Open LLM: Approximately -10% to +5%
* Close LLM: Approximately -10% to +5%
* Reasoning LLM: Approximately -10% to +5%
* **HumanEval:**
* LLaMA3.1-8B: Approximately -20% to +5%
* LLaMA3.1-70B: Approximately -20% to +5%
* Qwen.2.5-7B: Approximately -20% to +5%
* Qwen.2.5-72B: Approximately -20% to +5%
* Claude3.5: Approximately -20% to +5%
* GPT-3.5: Approximately -20% to +5%
* GPT-4.0: Approximately -20% to +5%
* QWQ-32B: Approximately -20% to +5%
* DeepSeek-V3: Approximately -20% to +5%
* Open LLM: Approximately -20% to +5%
* Close LLM: Approximately -20% to +5%
* Reasoning LLM: Approximately -20% to +5%
### Key Observations
* The performance varies significantly across datasets.
* LLaMA3.1-8B and LLaMA3.1-70B generally perform similarly.
* GPT-4.0 consistently shows strong performance across most datasets.
* Some models (e.g., DeepSeek-V3, QWQ-32B) exhibit more variability in performance across datasets.
* The "Reasoning LLM" consistently performs near or below the baseline.
### Interpretation
This plot provides a comparative analysis of LLM performance on a range of tasks represented by the different datasets. The Δ (%) metric allows for a direct comparison of how much better or worse each model performs relative to a baseline. The variability in performance across datasets suggests that different LLMs excel at different types of tasks. For example, a model that performs well on HotpotQA (question answering) might not perform as well on MATH (mathematical reasoning). The consistent strong performance of GPT-4.0 indicates its robustness and generalizability. The relatively poor performance of the "Reasoning LLM" suggests that reasoning capabilities are a challenge for this particular model or approach. The data suggests that model size (e.g., comparing LLaMA3.1-8B and LLaMA3.1-70B) does not always translate to significantly better performance, indicating that other factors, such as training data and model architecture, also play a crucial role.
DECODING INTELLIGENCE...