## Scatter Plot: Performance Change (Δ%) of Various LLMs Across Datasets
### Overview
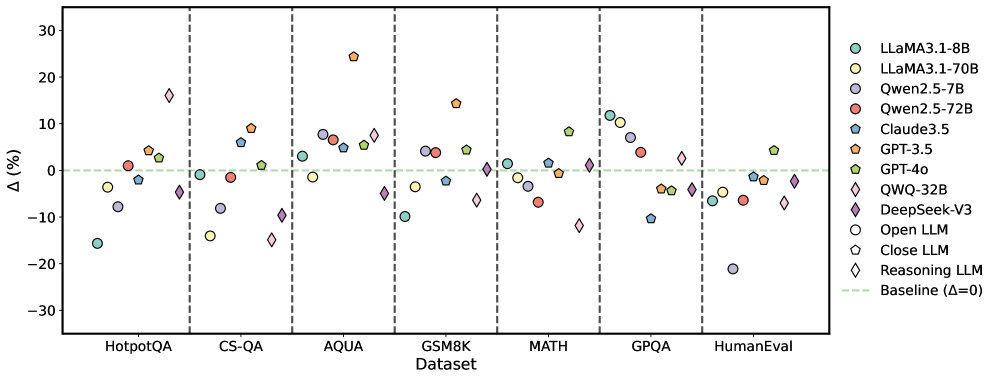
The image is a scatter plot comparing the performance change (Δ%) of multiple Large Language Models (LLMs) across seven different benchmark datasets. The plot uses distinct markers (shapes and colors) to represent each model, with a horizontal baseline at Δ=0%. The data points are grouped by dataset along the x-axis.
### Components/Axes
* **X-axis (Categorical):** Labeled "Dataset". The categories are, from left to right: `HotpotQA`, `CS-QA`, `AQUA`, `GSM8K`, `MATH`, `GPQA`, `HumanEval`.
* **Y-axis (Numerical):** Labeled "Δ(%)". The scale ranges from -30 to +30, with major tick marks at intervals of 10 (-30, -20, -10, 0, 10, 20, 30).
* **Baseline:** A horizontal, dashed, light green line at `Δ=0`, labeled "Baseline (Δ=0)" in the legend.
* **Legend (Positioned on the right side of the chart):** Contains 12 entries, defining the model names and their corresponding marker styles.
* **Models & Markers:**
* `LLaMA3.1-8B`: Teal circle (○)
* `LLaMA3.1-70B`: Yellow circle (○)
* `Qwen2.5-7B`: Purple circle (○)
* `Qwen2.5-72B`: Red circle (○)
* `Claude3.5`: Blue pentagon (⬠)
* `GPT-3.5`: Orange pentagon (⬠)
* `GPT-4o`: Green pentagon (⬠)
* `QWQ-32B`: Purple diamond (◇)
* `DeepSeek-V3`: Pink diamond (◇)
* **Model Type Indicators (Shapes):**
* `Open LLM`: Circle (○)
* `Close LLM`: Pentagon (⬠)
* `Reasoning LLM`: Diamond (◇)
### Detailed Analysis
The following table reconstructs the approximate Δ(%) values for each model on each dataset, based on visual inspection of the scatter plot. Values are approximate and carry uncertainty (±2-3%).
| Dataset | LLaMA3.1-8B (Teal ○) | LLaMA3.1-70B (Yellow ○) | Qwen2.5-7B (Purple ○) | Qwen2.5-72B (Red ○) | Claude3.5 (Blue ⬠) | GPT-3.5 (Orange ⬠) | GPT-4o (Green ⬠) | QWQ-32B (Purple ◇) | DeepSeek-V3 (Pink ◇) |
| :--- | :--- | :--- | :--- | :--- | :--- | :--- | :--- | :--- | :--- |
| **HotpotQA** | -15% | -3% | -7% | +1% | -2% | +4% | +3% | +16% | -4% |
| **CS-QA** | -1% | -14% | -8% | -1% | +6% | +9% | +1% | -10% | -15% |
| **AQUA** | +3% | -1% | +7% | +5% | +6% | +24% | +5% | -4% | +7% |
| **GSM8K** | -10% | -3% | +4% | +4% | -2% | +14% | +5% | -6% | +1% |
| **MATH** | +1% | -2% | -1% | -6% | +1% | -1% | +8% | -11% | +1% |
| **GPQA** | +12% | +10% | -4% | +4% | -10% | -4% | -4% | +3% | -4% |
| **HumanEval** | -6% | -21% | -1% | -6% | -1% | -4% | +4% | -6% | -2% |
### Key Observations
1. **High Variance:** Performance change (Δ%) varies dramatically both across models for a single dataset and for a single model across datasets. No single model consistently outperforms others.
2. **Dataset Difficulty:** `HumanEval` and `CS-QA` show the most negative trends overall, with several models showing significant performance drops (e.g., LLaMA3.1-70B at ~-21% on HumanEval). `AQUA` and `GPQA` show more positive trends.
3. **Model-Specific Trends:**
* **GPT-3.5 (Orange ⬠):** Shows the highest single positive outlier, with a Δ of ~+24% on `AQUA`. It also performs well on `GSM8K` (+14%).
* **QWQ-32B (Purple ◇):** Exhibits extreme volatility. It has the highest positive Δ on `HotpotQA` (~+16%) but one of the lowest on `MATH` (~-11%).
* **LLaMA3.1-70B (Yellow ○):** Shows significant negative performance on `CS-QA` (~-14%) and `HumanEval` (~-21%).
* **GPT-4o (Green ⬠):** Shows relatively stable, modest positive performance, with its highest gain on `MATH` (~+8%).
4. **Model Type Pattern:** There is no clear, consistent separation in performance trends between the indicated model types (Open LLM, Close LLM, Reasoning LLM). All three types have models showing both high positive and high negative Δ values.
### Interpretation
This chart visualizes the **relative performance shift** of various LLMs compared to an unspecified baseline (likely a previous model version or a different prompting/evaluation setup). The key takeaway is the **highly dataset-dependent nature of LLM performance improvements or regressions**.
* **What the data suggests:** A model's architecture or training that leads to a large gain on one type of reasoning task (e.g., GPT-3.5 on `AQUA`) does not guarantee similar gains on another (e.g., its performance on `GPQA` is slightly negative). This highlights the challenge of creating general-purpose AI and the importance of multi-dataset benchmarking.
* **Relationship between elements:** The scatter plot format effectively shows the distribution and spread of performance changes. The clustering of points around the zero line for some datasets (e.g., `MATH`) versus the wide dispersion for others (e.g., `AQUA`, `GPQA`) indicates varying levels of consensus or divergence in how models handle different problem types.
* **Notable anomalies:** The extreme positive outlier for GPT-3.5 on `AQUA` and the extreme negative outlier for LLaMA3.1-70B on `HumanEval` are significant. These could indicate specific strengths or weaknesses in the models' training data, reasoning capabilities, or sensitivity to the evaluation methodology of those particular benchmarks. The volatility of the "Reasoning LLM" QWQ-32B suggests its specialized training may yield high rewards on certain tasks but at the cost of robustness on others.