## Scatter Plot: Language Model Performance Comparison Across Datasets
### Overview
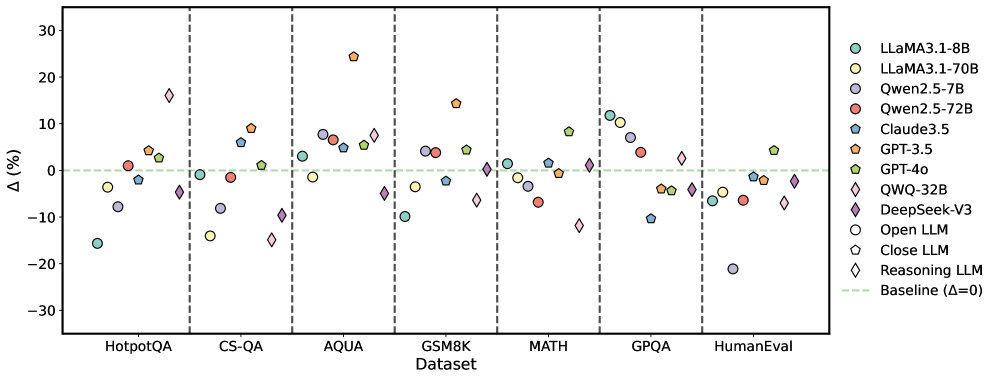
The image is a scatter plot comparing the performance of various large language models (LLMs) across seven benchmark datasets. Each data point represents the percentage change (Δ%) in performance relative to a baseline (Δ=0), with models differentiated by color and shape in the legend. The plot highlights variations in model effectiveness across tasks like question answering, reasoning, and human evaluation.
### Components/Axes
- **X-Axis (Dataset)**: Categorized into seven benchmark datasets:
- HotpotQA
- CS-QA
- AQUA
- GSM8K
- MATH
- GPQA
- HumanEval
Vertical dashed lines separate each dataset.
- **Y-Axis (Δ%)**: Percentage change in performance, ranging from -30% to +30%, with a horizontal dashed line at 0% (baseline).
- **Legend**: Located on the right, mapping 11 models to colors and shapes:
- LLaMA3.1-8B (cyan circle)
- LLaMA3.1-70B (yellow circle)
- Qwen2.5-7B (purple circle)
- Qwen2.5-72B (red circle)
- Claude3.5 (blue pentagon)
- GPT-3.5 (orange pentagon)
- GPT-4o (green pentagon)
- QWQ-32B (pink diamond)
- DeepSeek-V3 (purple diamond)
- Open LLM (gray circle)
- Close LLM (gray pentagon)
- Reasoning LLM (pink diamond)
### Detailed Analysis
- **HotpotQA**:
- LLaMA3.1-8B: -15% (cyan circle, below baseline)
- Qwen2.5-7B: -10% (purple circle)
- GPT-3.5: +5% (orange pentagon)
- Reasoning LLM: -5% (pink diamond)
- **CS-QA**:
- GPT-3.5: +15% (orange pentagon, highest Δ)
- LLaMA3.1-70B: -15% (yellow circle)
- Qwen2.5-72B: +5% (red circle)
- **AQUA**:
- GPT-4o: +25% (green pentagon, highest Δ)
- QWQ-32B: +10% (pink diamond)
- Claude3.5: -10% (blue pentagon)
- **GSM8K**:
- GPT-3.5: +15% (orange pentagon)
- Qwen2.5-72B: +5% (red circle)
- Reasoning LLM: -5% (pink diamond)
- **MATH**:
- LLaMA3.1-70B: +10% (yellow circle)
- Qwen2.5-7B: -5% (purple circle)
- DeepSeek-V3: +5% (purple diamond)
- **GPQA**:
- GPT-4o: -5% (green pentagon)
- QWQ-32B: -10% (pink diamond)
- Open LLM: -15% (gray circle)
- **HumanEval**:
- GPT-4o: +5% (green pentagon)
- Qwen2.5-72B: -10% (red circle)
- Reasoning LLM: -5% (pink diamond)
### Key Observations
1. **GPT Models Dominance**: GPT-3.5 and GPT-4o consistently show high Δ% in datasets like AQUA (+25%) and CS-QA (+15%), suggesting superior performance in reasoning and coding tasks.
2. **LLaMA3.1-8B Underperformance**: LLaMA3.1-8B (cyan circle) lags in HotpotQA (-15%) and CS-QA (-15%), indicating weaker capabilities in question-answering tasks.
3. **Reasoning LLMs (Diamonds)**: Mixed results, with QWQ-32B (pink diamond) showing +10% in AQUA but -10% in GPQA.
4. **Baseline Deviations**: Most models deviate significantly from the baseline (Δ=0), with extremes like GPT-4o (+25%) and LLaMA3.1-8B (-15%).
### Interpretation
The chart reveals that model performance is highly dataset-dependent. GPT-3.5 and GPT-4o excel in reasoning-heavy tasks (AQUA, CS-QA), while LLaMA3.1-8B struggles in question-answering benchmarks. The reasoning LLMs (diamonds) show variability, suggesting specialized architectures may not universally outperform general-purpose models. The baseline (Δ=0) acts as a critical reference, emphasizing that even small deviations (e.g., +5% or -5%) can signify meaningful differences in real-world applications. Notably, the absence of data points near the baseline in datasets like MATH and GPQA implies that most models either significantly improve or decline in performance compared to the baseline.