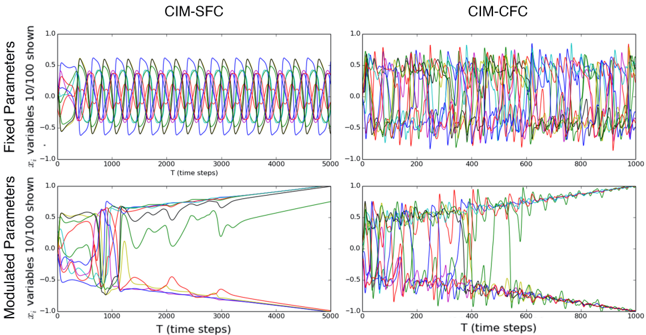
## Time Series Plots: CIM-SFC vs. CIM-CFC
### Overview
The image presents four time series plots, arranged in a 2x2 grid. The plots compare two models, CIM-SFC and CIM-CFC, under two parameter conditions: "Fixed Parameters" (top row) and "Modulated Parameters" (bottom row). The y-axis represents the value of variables (x_i), and the x-axis represents time steps (T). Each plot shows 10 out of 100 variables.
### Components/Axes
* **Titles:**
* Top-Left: CIM-SFC (Fixed Parameters)
* Top-Right: CIM-CFC (Fixed Parameters)
* Bottom-Left: CIM-SFC (Modulated Parameters)
* Bottom-Right: CIM-CFC (Modulated Parameters)
* **Y-Axis:**
* Label (Left Side, Top Plots): "Fixed Parameters"
* Label (Left Side, Bottom Plots): "Modulated Parameters"
* Label (Right Side, All Plots): "x_i variables 10/100 shown"
* Scale: -1.0 to 1.0, with markers at -1.0, -0.5, 0.0, 0.5, and 1.0
* **X-Axis:**
* Label (All Plots): "T (time steps)"
* Scale (CIM-SFC Plots): 0 to 5000, with markers at 0, 1000, 2000, 3000, 4000, and 5000
* Scale (CIM-CFC Plots): 0 to 1000, with markers at 0, 200, 400, 600, 800, and 1000
* **Data Series:** Each plot contains multiple time series, each represented by a different color. There is no explicit legend.
### Detailed Analysis
**1. CIM-SFC (Fixed Parameters) - Top-Left Plot:**
* Trend: The time series exhibit oscillatory behavior with a consistent amplitude and frequency.
* Values: The oscillations range approximately from -0.8 to 0.8.
* Colors: Multiple colors are present, including blue, green, red, black, magenta, and cyan.
**2. CIM-CFC (Fixed Parameters) - Top-Right Plot:**
* Trend: The time series show irregular oscillations with varying amplitudes and frequencies.
* Values: The oscillations range approximately from -0.8 to 0.8.
* Colors: Multiple colors are present, including blue, green, red, black, magenta, and cyan.
**3. CIM-SFC (Modulated Parameters) - Bottom-Left Plot:**
* Trend: The time series start with irregular behavior, then converge towards a stable state. Some series approach 1.0, while others approach -1.0.
* Values: Initial values range from -1.0 to 1.0. Final values converge near -1.0 and 1.0.
* Colors: Multiple colors are present, including blue, green, red, black, magenta, and cyan.
**4. CIM-CFC (Modulated Parameters) - Bottom-Right Plot:**
* Trend: The time series exhibit initial fluctuations, then converge towards a stable state. Most series approach -1.0.
* Values: Initial values range from -1.0 to 1.0. Final values converge near -1.0.
* Colors: Multiple colors are present, including blue, green, red, black, magenta, and cyan.
### Key Observations
* **Fixed Parameters:** CIM-SFC shows regular oscillations, while CIM-CFC shows irregular oscillations.
* **Modulated Parameters:** Both models converge to stable states, but CIM-SFC shows convergence to both positive and negative values, while CIM-CFC primarily converges to negative values.
* **Time Scale:** CIM-SFC plots cover a longer time scale (0-5000) compared to CIM-CFC plots (0-1000).
### Interpretation
The plots compare the behavior of two models, CIM-SFC and CIM-CFC, under different parameter conditions. The "Fixed Parameters" plots show the inherent oscillatory dynamics of the models. The "Modulated Parameters" plots demonstrate how the models respond to changing conditions, with both models eventually reaching stable states. The difference in convergence behavior between CIM-SFC and CIM-CFC under modulated parameters suggests that the models have different sensitivities or responses to the modulation. The longer time scale of the CIM-SFC plots may indicate that this model takes longer to reach a stable state under modulated conditions.