## Line Chart: Llama-3-8B and Llama-3-70B Model Performance Comparison
### Overview
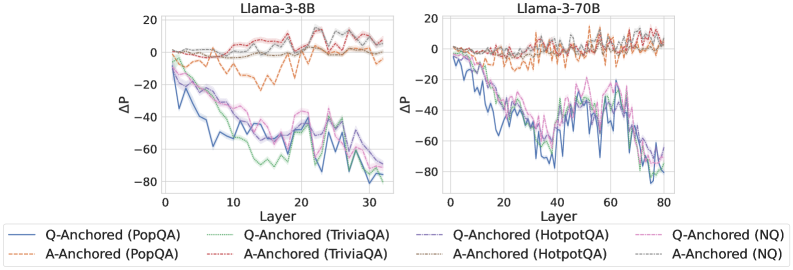
The image contains two side-by-side line charts comparing the performance of Q-Anchored and A-Anchored models across different datasets (PopQA, TriviaQA, HotpotQA, NQ) for two versions of the Llama-3 model (3-8B and 3-70B). The y-axis represents ΔP (change in performance), and the x-axis represents model layers. Each chart shows distinct trends for Q-Anchored (solid lines) and A-Anchored (dashed lines) configurations.
---
### Components/Axes
- **X-Axis (Layer)**:
- Llama-3-8B: 0 to 30 (integer increments).
- Llama-3-70B: 0 to 80 (integer increments).
- **Y-Axis (ΔP)**:
- Range: -80 to 20 (integer increments).
- **Legends**:
- Positioned at the bottom of each chart.
- Colors and styles correspond to:
- **Q-Anchored**: Solid lines (blue, green, purple, pink).
- **A-Anchored**: Dashed lines (orange, gray, brown, black).
- Datasets: PopQA, TriviaQA, HotpotQA, NQ.
---
### Detailed Analysis
#### Llama-3-8B Chart
- **Q-Anchored (PopQA)**: Blue solid line. Starts at 0, dips sharply to -60 by layer 10, then fluctuates between -40 and -20.
- **Q-Anchored (TriviaQA)**: Green dashed line. Starts at 0, drops to -50 by layer 15, then stabilizes near -30.
- **Q-Anchored (HotpotQA)**: Purple solid line. Starts at 0, declines to -70 by layer 20, then oscillates between -50 and -30.
- **Q-Anchored (NQ)**: Pink dashed line. Starts at 0, dips to -40 by layer 10, then stabilizes near -20.
- **A-Anchored (PopQA)**: Orange solid line. Remains near 0 with minor fluctuations.
- **A-Anchored (TriviaQA)**: Gray dashed line. Starts at 0, dips to -10 by layer 10, then stabilizes.
- **A-Anchored (HotpotQA)**: Brown solid line. Starts at 0, fluctuates between -5 and 5.
- **A-Anchored (NQ)**: Black dashed line. Starts at 0, dips to -5 by layer 10, then stabilizes.
#### Llama-3-70B Chart
- **Q-Anchored (PopQA)**: Blue solid line. Starts at 0, drops to -80 by layer 40, then fluctuates between -60 and -40.
- **Q-Anchored (TriviaQA)**: Green dashed line. Starts at 0, declines to -70 by layer 50, then stabilizes near -50.
- **Q-Anchored (HotpotQA)**: Purple solid line. Starts at 0, drops to -90 by layer 60, then oscillates between -70 and -50.
- **Q-Anchored (NQ)**: Pink dashed line. Starts at 0, dips to -60 by layer 30, then stabilizes near -40.
- **A-Anchored (PopQA)**: Orange solid line. Remains near 0 with minor fluctuations.
- **A-Anchored (TriviaQA)**: Gray dashed line. Starts at 0, dips to -15 by layer 20, then stabilizes.
- **A-Anchored (HotpotQA)**: Brown solid line. Starts at 0, fluctuates between -10 and 10.
- **A-Anchored (NQ)**: Black dashed line. Starts at 0, dips to -10 by layer 10, then stabilizes.
---
### Key Observations
1. **Q-Anchored vs. A-Anchored**:
- Q-Anchored models show larger ΔP deviations (negative trends) across all datasets, especially in deeper layers.
- A-Anchored models exhibit smaller, more stable ΔP values, often remaining near 0.
2. **Model Size Impact**:
- Llama-3-70B shows more pronounced ΔP declines for Q-Anchored models compared to Llama-3-8B, suggesting scalability challenges.
3. **Dataset Sensitivity**:
- HotpotQA (Q-Anchored) demonstrates the steepest ΔP decline in both models, indicating higher sensitivity to anchoring methods.
4. **Layer Depth Correlation**:
- ΔP trends generally worsen as layer depth increases, particularly for Q-Anchored configurations.
---
### Interpretation
The data suggests that **Q-Anchored models** are more sensitive to layer depth and dataset complexity, leading to larger performance deviations (ΔP). This could imply that Q-Anchored configurations struggle with maintaining consistency in deeper layers or with complex datasets like HotpotQA. In contrast, **A-Anchored models** maintain stability, indicating robustness to layer depth and dataset variations. The Llama-3-70B model’s amplified ΔP trends for Q-Anchored configurations highlight potential scalability issues, suggesting that anchoring strategies may need adjustment for larger models. The divergence between Q and A anchoring methods underscores the importance of anchoring choice in model performance optimization.