\n
## Line Chart: ΔP vs. Layer for Llama Models
### Overview
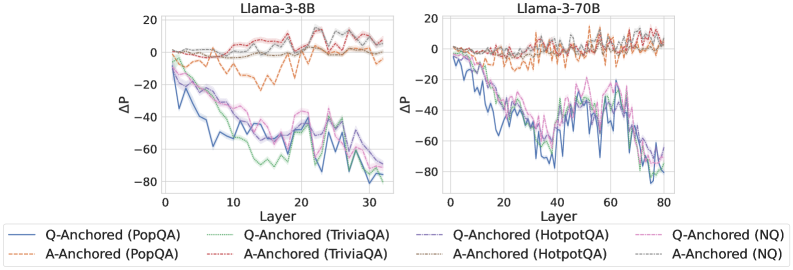
The image presents two line charts comparing the change in performance (ΔP) across layers for two Llama models: Llama-3-8B and Llama-3-70B. The x-axis represents the layer number, and the y-axis represents ΔP. Each chart displays multiple lines, each representing a different question-answering dataset and anchoring method.
### Components/Axes
* **X-axis:** Layer (ranging from 0 to 30 for Llama-3-8B and 0 to 80 for Llama-3-70B).
* **Y-axis:** ΔP (ranging from approximately -80 to 20).
* **Models:** Llama-3-8B (left chart), Llama-3-70B (right chart).
* **Datasets/Anchoring Methods (Legend):**
* Q-Anchored (PopQA) - Blue solid line
* A-Anchored (PopQA) - Orange dashed line
* Q-Anchored (TriviaQA) - Green solid line
* A-Anchored (TriviaQA) - Purple dashed line
* Q-Anchored (HotpotQA) - Brown dashed-dotted line
* A-Anchored (HotpotQA) - Pink dashed line
* Q-Anchored (NQ) - Light Blue solid line
* A-Anchored (NQ) - Teal solid line
### Detailed Analysis or Content Details
**Llama-3-8B (Left Chart):**
* **Q-Anchored (PopQA):** Starts at approximately -20, sharply decreases to around -70 by layer 5, then fluctuates between -50 and -70 until layer 30.
* **A-Anchored (PopQA):** Starts at approximately 10, gradually decreases to around -10 by layer 30, with some fluctuations.
* **Q-Anchored (TriviaQA):** Starts at approximately -10, decreases to around -60 by layer 5, then fluctuates between -40 and -60 until layer 30.
* **A-Anchored (TriviaQA):** Starts at approximately 5, decreases to around -20 by layer 30, with some fluctuations.
* **Q-Anchored (HotpotQA):** Starts at approximately 0, decreases to around -50 by layer 5, then fluctuates between -30 and -50 until layer 30.
* **A-Anchored (HotpotQA):** Starts at approximately 10, decreases to around -10 by layer 30, with some fluctuations.
* **Q-Anchored (NQ):** Starts at approximately -15, decreases to around -65 by layer 5, then fluctuates between -50 and -65 until layer 30.
* **A-Anchored (NQ):** Starts at approximately 5, decreases to around -20 by layer 30, with some fluctuations.
**Llama-3-70B (Right Chart):**
* **Q-Anchored (PopQA):** Starts at approximately -20, decreases to around -60 by layer 20, then fluctuates between -40 and -60 until layer 80.
* **A-Anchored (PopQA):** Starts at approximately 10, gradually decreases to around -10 by layer 80, with some fluctuations.
* **Q-Anchored (TriviaQA):** Starts at approximately -10, decreases to around -50 by layer 20, then fluctuates between -30 and -50 until layer 80.
* **A-Anchored (TriviaQA):** Starts at approximately 5, decreases to around -15 by layer 80, with some fluctuations.
* **Q-Anchored (HotpotQA):** Starts at approximately 0, decreases to around -40 by layer 20, then fluctuates between -20 and -40 until layer 80.
* **A-Anchored (HotpotQA):** Starts at approximately 10, decreases to around -10 by layer 80, with some fluctuations.
* **Q-Anchored (NQ):** Starts at approximately -15, decreases to around -55 by layer 20, then fluctuates between -40 and -55 until layer 80.
* **A-Anchored (NQ):** Starts at approximately 5, decreases to around -15 by layer 80, with some fluctuations.
### Key Observations
* In both models, the Q-Anchored lines generally exhibit a more significant decrease in ΔP compared to the A-Anchored lines.
* The initial performance (ΔP at layer 0) is generally higher for A-Anchored methods.
* The rate of performance decrease appears to slow down in later layers for both models.
* The Llama-3-70B model shows a more gradual decline in ΔP across layers compared to the Llama-3-8B model.
* The lines for the different datasets tend to cluster together, suggesting a common trend in performance change.
### Interpretation
The charts illustrate how performance changes across layers for different question-answering datasets and anchoring methods in two Llama models. The negative ΔP values indicate a performance decrease as the model processes deeper layers. The steeper decline in Q-Anchored methods suggests that question-based anchoring might be more sensitive to layer depth or require more careful tuning. The larger model (Llama-3-70B) exhibits a more stable performance profile, indicating that increased model size can mitigate the performance degradation observed in the smaller model (Llama-3-8B). The consistent trend across datasets suggests that the observed performance changes are not specific to any particular question-answering task. The difference between A-Anchored and Q-Anchored methods could be due to the way information is incorporated into the model during training or inference. The charts provide valuable insights into the behavior of these models and can inform strategies for improving their performance and stability.