# Technical Document Extraction: Bar Chart Analysis
## Chart Type
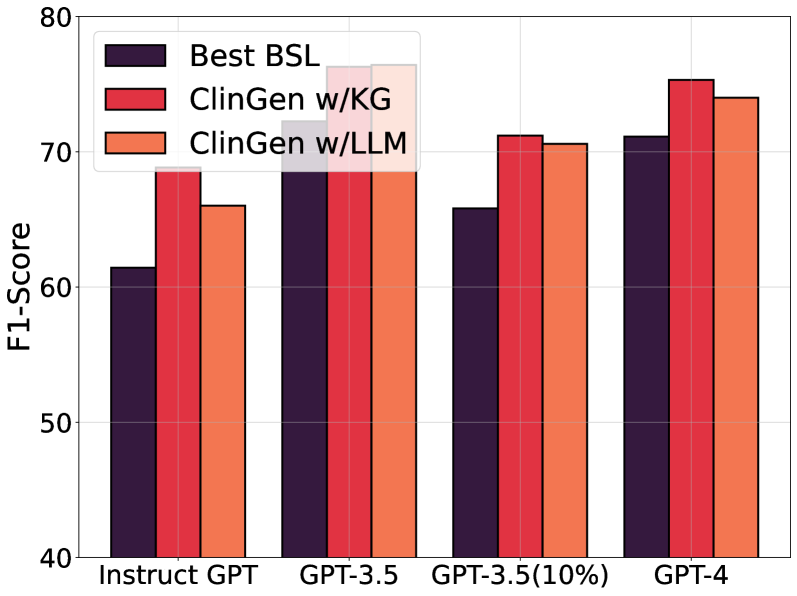
Bar chart comparing F1-Score performance across different GPT model configurations and methods.
## Axes
- **Y-Axis**:
- Label: "F1-Score"
- Range: 40 to 80 (in increments of 10)
- **X-Axis**:
- Categories:
1. "Instruct GPT"
2. "GPT-3.5"
3. "GPT-3.5(10%)"
4. "GPT-4"
## Legend
- **Labels & Colors**:
- **Dark Purple**: "Best BSL"
- **Red**: "ClinGen w/KG"
- **Orange**: "ClinGen w/LLM"
## Data Categories
1. **Methods**:
- Best BSL
- ClinGen w/KG
- ClinGen w/LLM
2. **GPT Model Configurations**:
- Instruct GPT
- GPT-3.5
- GPT-3.5 (10% subset)
- GPT-4
## Key Trends
1. **Performance Hierarchy**:
- **ClinGen w/KG** consistently achieves the highest F1-Scores across all GPT configurations.
- **ClinGen w/LLM** follows closely, with scores slightly lower than ClinGen w/KG.
- **Best BSL** performs the lowest, with scores significantly below the other two methods.
2. **Model-Specific Observations**:
- **Instruct GPT**:
- ClinGen w/KG: ~78
- ClinGen w/LLM: ~76
- Best BSL: ~62
- **GPT-3.5**:
- ClinGen w/KG: ~76
- ClinGen w/LLM: ~74
- Best BSL: ~66
- **GPT-3.5(10%)**:
- ClinGen w/KG: ~74
- ClinGen w/LLM: ~72
- Best BSL: ~66
- **GPT-4**:
- ClinGen w/KG: ~77
- ClinGen w/LLM: ~75
- Best BSL: ~71
3. **Subset Impact**:
- The "GPT-3.5(10%)" configuration shows a ~2-point drop in F1-Score compared to the full GPT-3.5 for all methods.
## Data Points
| GPT Configuration | Best BSL | ClinGen w/KG | ClinGen w/LLM |
|-------------------------|----------|--------------|---------------|
| Instruct GPT | 62 | 78 | 76 |
| GPT-3.5 | 66 | 76 | 74 |
| GPT-3.5(10%) | 66 | 74 | 72 |
| GPT-4 | 71 | 77 | 75 |
## Notes
- All values are approximate, derived from bar heights relative to the Y-axis scale.
- ClinGen w/KG and ClinGen w/LLM demonstrate strong performance parity, with ClinGen w/KG maintaining a marginal edge.
- Best BSL shows limited improvement across model upgrades, remaining the lowest performer.