# Technical Document Extraction: WSe2 Fermi Surface Analysis
## Image Overview
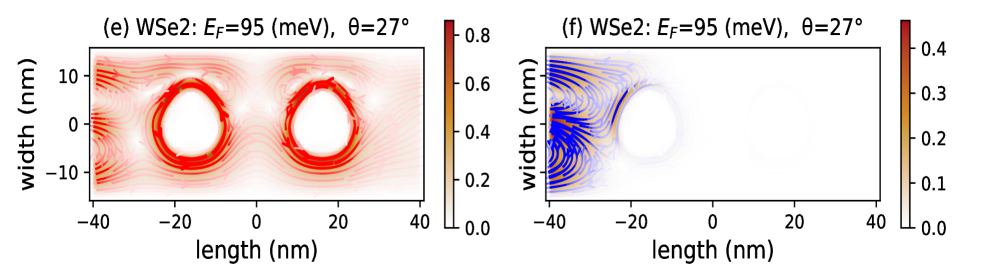
The image contains two side-by-side heatmaps labeled **(e)** and **(f)**, depicting Fermi surface intensity distributions for tungsten diselenide (WSe₂) at a Fermi energy (**E_F**) of 95 meV and an angle (θ) of 27°. Both panels share identical axis labels and spatial dimensions but differ in intensity distribution patterns.
---
### Panel (e): WSe2 Fermi Surface (E_F=95 meV, θ=27°)
#### Labels & Axis Titles
- **X-axis**: `length (nm)` (range: -40 to 40 nm)
- **Y-axis**: `width (nm)` (range: -10 to 10 nm)
- **Panel Title**: `(e) WSe2: E_F=95 (meV), θ=27°`
#### Color Scale & Legend
- **Color Bar**: Red gradient (left: 0.0, right: 0.8)
- **Spatial Grounding**: Legend positioned on the right edge of the panel.
#### Key Trends & Data Points
1. **Intensity Distribution**:
- Two high-intensity circular regions centered at approximately:
- **Left**: (-15 nm, 0 nm)
- **Right**: (15 nm, 0 nm)
- Intensity decays radially outward from these centers, forming concentric interference-like patterns.
- Maximum intensity value: **0.8** (red peak).
2. **Spatial Symmetry**:
- Symmetric distribution about the y-axis (width = 0 nm).
- No significant intensity variation along the x-axis beyond ±20 nm.
---
### Panel (f): WSe2 Fermi Surface (E_F=95 meV, θ=27°)
#### Labels & Axis Titles
- **X-axis**: `length (nm)` (range: -40 to 40 nm)
- **Y-axis**: `width (nm)` (range: -10 to 10 nm)
- **Panel Title**: `(f) WSe2: E_F=95 (meV), θ=27°`
#### Color Scale & Legend
- **Color Bar**: Blue gradient (left: 0.0, right: 0.4)
- **Spatial Grounding**: Legend positioned on the right edge of the panel.
#### Key Trends & Data Points
1. **Intensity Distribution**:
- Single elongated high-intensity region centered at approximately:
- **Center**: (0 nm, 0 nm)
- Intensity gradient extends asymmetrically toward the left (negative x-axis), with a sharp decay toward the right.
- Maximum intensity value: **0.4** (blue peak).
2. **Asymmetry**:
- Dominant intensity on the left side of the center (x < 0 nm).
- Minimal intensity on the right side (x > 0 nm).
---
### Comparative Analysis
| Feature | Panel (e) | Panel (f) |
|------------------------|------------------------------------|------------------------------------|
| **Intensity Scale** | 0.0–0.8 (red) | 0.0–0.4 (blue) |
| **Bright Regions** | Two symmetric circular peaks | One asymmetric elongated peak |
| **Dominant Direction** | Radial symmetry | Leftward asymmetry |
| **Color Legend** | Red (high intensity) | Blue (low intensity) |
---
### Textual Elements
- **Embedded Text**:
- Panel (e): `(e) WSe2: E_F=95 (meV), θ=27°`
- Panel (f): `(f) WSe2: E_F=95 (meV), θ=27°`
- **Axis Labels**:
- X-axis: `length (nm)`
- Y-axis: `width (nm)`
- **Legend Text**:
- Color bar labels: `0.0` (minimum) to `0.8` (panel e) / `0.4` (panel f).
---
### Language & Transcription
- **Primary Language**: English (all labels, titles, and axis markers are in English).
- **No Additional Languages Detected**.
---
### Conclusion
The heatmaps visualize Fermi surface intensity distributions for WSe₂ at identical experimental conditions (E_F=95 meV, θ=27°). Panel (e) exhibits symmetric double-peak intensity, while panel (f) shows an asymmetric single-peak distribution. The color scales and spatial grounding confirm the intensity magnitudes and directional trends.