# Technical Document Extraction: ADP-MA Interface
## 1. Document Overview
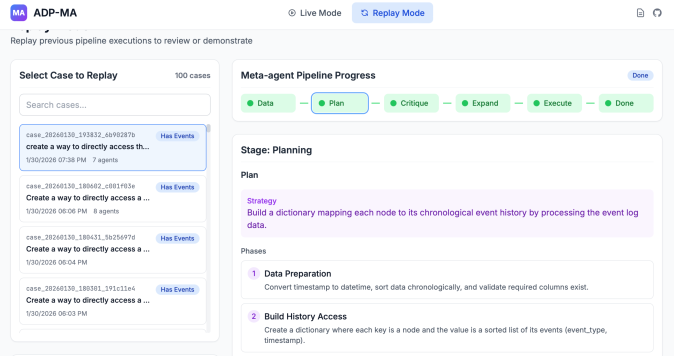
This image displays a web-based dashboard for a system titled **ADP-MA**. The interface is currently in **Replay Mode**, designed to "Replay previous pipeline executions to review or demonstrate." The layout is divided into a navigation sidebar on the left and a detailed execution view on the right.
---
## 2. Header Section
* **Application Name:** ADP-MA (accompanied by a purple 'MA' logo).
* **Mode Toggle:**
* **Live Mode:** Inactive (indicated by a radio button icon).
* **Replay Mode:** Active (highlighted in blue with a refresh/replay icon).
* **Utility Icons:** Document icon and GitHub logo (top right).
* **Sub-header Text:** "Replay previous pipeline executions to review or demonstrate"
---
## 3. Sidebar: "Select Case to Replay"
This section allows users to browse historical execution cases. It indicates a total of **100 cases**.
### Search and Filter
* **Search Bar:** Placeholder text "Search cases..."
### Case List (Transcribed Entries)
The list shows several cases, each with a unique ID, a description, a timestamp, and an agent count. All visible cases are tagged with a blue badge labeled **"Has Events"**.
| Case ID | Description Snippet | Timestamp | Agent Count |
| :--- | :--- | :--- | :--- |
| `case_20260130_193832_6b90287b` | create a way to directly access th... | 1/30/2026 07:38 PM | 7 agents |
| `case_20260130_180602_c001f03e` | Create a way to directly access a ... | 1/30/2026 06:06 PM | 8 agents |
| `case_20260130_180431_5b25697d` | Create a way to directly access a ... | 1/30/2026 06:04 PM | [Not visible] |
| `case_20260130_180301_191c11e4` | Create a way to directly access a ... | 1/30/2026 06:03 PM | [Not visible] |
*Note: The first case is highlighted with a blue border, indicating it is the currently selected case.*
---
## 4. Main Content: Meta-agent Pipeline Progress
This section tracks the lifecycle of the selected case.
### Pipeline Flow Diagram
The pipeline consists of six sequential stages connected by lines. All stages are marked with a green dot, and the final status is marked as **"Done"** in a blue badge.
1. **Data** (Green background)
2. **Plan** (Light blue background with blue border - **Current Focus**)
3. **Critique** (Green background)
4. **Expand** (Green background)
5. **Execute** (Green background)
6. **Done** (Green background)
### Stage Detail: Planning
The interface displays the specific details for the **"Plan"** stage of the pipeline.
#### Plan Strategy
* **Label:** Strategy (Purple text)
* **Content:** "Build a dictionary mapping each node to its chronological event history by processing the event log data."
#### Phases
The plan is broken down into two numbered phases:
1. **Data Preparation**
* **Description:** "Convert timestamp to datetime, sort data chronologically, and validate required columns exist."
2. **Build History Access**
* **Description:** "Create a dictionary where each key is a node and the value is a sorted list of its events (event_type, timestamp)."
---
## 5. Technical Components & Logic
* **Spatial Grounding:** The legend/progress bar is located at the top of the main content area. The "Plan" node is visually distinct (blue border), which corresponds to the "Stage: Planning" header immediately below it.
* **Trend/Flow:** The pipeline follows a linear progression from data ingestion to execution. The green coloring across all nodes suggests a completed or successful historical run.
* **Data Structure:** The "Strategy" and "Phases" sections indicate that the system operates on event log data, utilizing Python-like data structures (dictionaries) and standard data cleaning procedures (datetime conversion, validation).