## Line Graphs: Accuracy of Game 24 vs. Iteration
### Overview
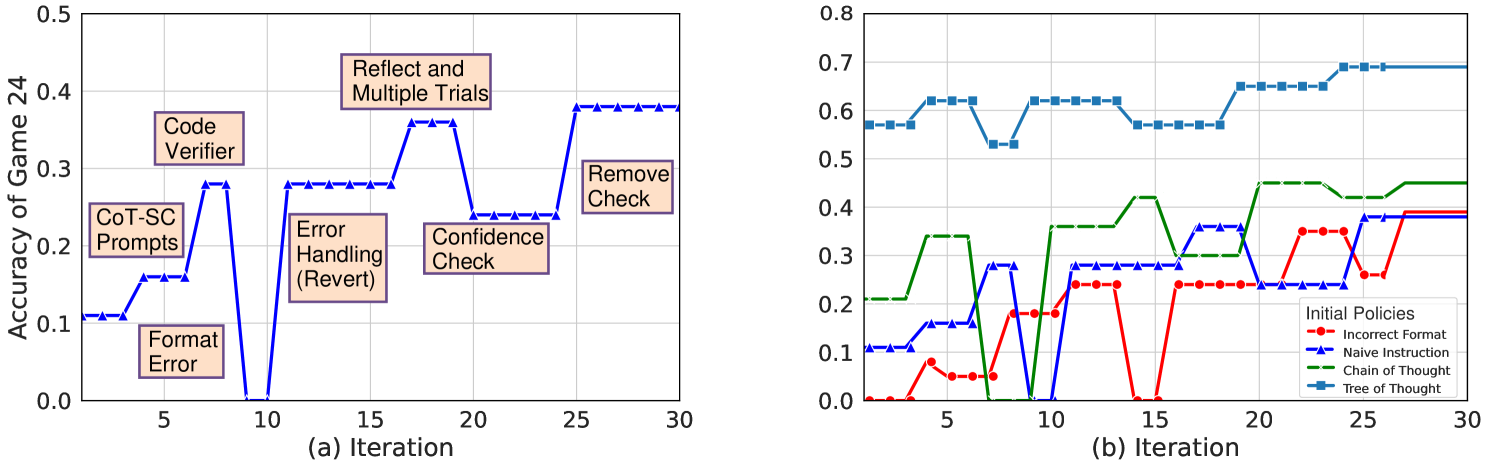
The image contains two line graphs comparing the accuracy of a game (Game 24) across iterations. The left graph (a) shows the impact of different code modifications on accuracy, while the right graph (b) compares the performance of different initial policies.
### Components/Axes
**Left Graph (a):**
* **Title:** Accuracy of Game 24
* **X-axis:** (a) Iteration, ranging from 0 to 30 in increments of 5.
* **Y-axis:** Accuracy of Game 24, ranging from 0.0 to 0.5 in increments of 0.1.
* **Data Series:** Single blue line with triangle markers.
* **Annotations:**
* "Format Error" at iteration ~3, accuracy ~0.1
* "CoT-SC Prompts" at iteration ~6, accuracy ~0.2
* "Code Verifier" at iteration ~8, accuracy ~0.3
* "Error Handling (Revert)" at iteration ~13, accuracy ~0.3
* "Confidence Check" at iteration ~19, accuracy ~0.2
* "Reflect and Multiple Trials" at iteration ~23, accuracy ~0.4
* "Remove Check" at iteration ~27, accuracy ~0.4
**Right Graph (b):**
* **Title:** Implicitly "Accuracy of Game 24"
* **X-axis:** (b) Iteration, ranging from 0 to 30 in increments of 5.
* **Y-axis:** Implicitly "Accuracy of Game 24", ranging from 0.0 to 0.8 in increments of 0.1.
* **Legend (Initial Policies, located at the bottom-right):**
* Red line with circle markers: Incorrect Format
* Blue line with triangle markers: Naive Instruction
* Green dashed line with cross markers: Chain of Thought
* Teal line with square markers: Tree of Thought
### Detailed Analysis
**Left Graph (a): Code Modifications**
* **Trend:** The blue line shows a fluctuating accuracy with iterations. It starts at ~0.1, rises to ~0.3, drops to ~0.0, rises again to ~0.4, drops to ~0.2, and finally plateaus at ~0.4.
* **Data Points (Approximate):**
* Iteration 1: 0.1
* Iteration 8: 0.3
* Iteration 10: 0.0
* Iteration 15: 0.3
* Iteration 20: 0.2
* Iteration 25: 0.4
* Iteration 30: 0.4
**Right Graph (b): Initial Policies**
* **Incorrect Format (Red):** The red line starts at 0.0, rises to ~0.2 by iteration 7, plateaus around ~0.25 until iteration 15, then rises to ~0.38 by iteration 28, and plateaus.
* Iteration 1: 0.0
* Iteration 7: 0.2
* Iteration 15: 0.25
* Iteration 28: 0.38
* Iteration 30: 0.38
* **Naive Instruction (Blue):** The blue line starts at ~0.1, rises sharply to ~0.3 by iteration 10, drops to ~0.1 by iteration 12, rises again to ~0.4 by iteration 25, and plateaus.
* Iteration 1: 0.1
* Iteration 10: 0.3
* Iteration 12: 0.1
* Iteration 25: 0.4
* Iteration 30: 0.4
* **Chain of Thought (Green):** The green dashed line starts at ~0.2, rises to ~0.4 by iteration 10, plateaus around ~0.4 until iteration 25, then rises to ~0.45 by iteration 30.
* Iteration 1: 0.2
* Iteration 10: 0.4
* Iteration 25: 0.4
* Iteration 30: 0.45
* **Tree of Thought (Teal):** The teal line starts at ~0.6, fluctuates slightly, and plateaus around ~0.7 after iteration 25.
* Iteration 1: 0.6
* Iteration 25: 0.7
* Iteration 30: 0.7
### Key Observations
* In the left graph, the "Code Verifier" modification shows a significant increase in accuracy, while "Confidence Check" leads to a decrease.
* In the right graph, "Tree of Thought" consistently outperforms other initial policies. "Incorrect Format" starts low but improves over iterations.
### Interpretation
The graphs suggest that specific code modifications (left graph) and initial policies (right graph) significantly impact the accuracy of Game 24. The "Tree of Thought" policy appears to be the most effective initial strategy, while certain code modifications like "Code Verifier" improve accuracy, and others like "Confidence Check" may hinder it. The fluctuations in accuracy with different modifications indicate the importance of careful code design and testing. The improvement of "Incorrect Format" over time suggests that the system learns and adapts even with a flawed initial policy.