\n
## Line Charts: Accuracy of Game 24 Over Iterations
### Overview
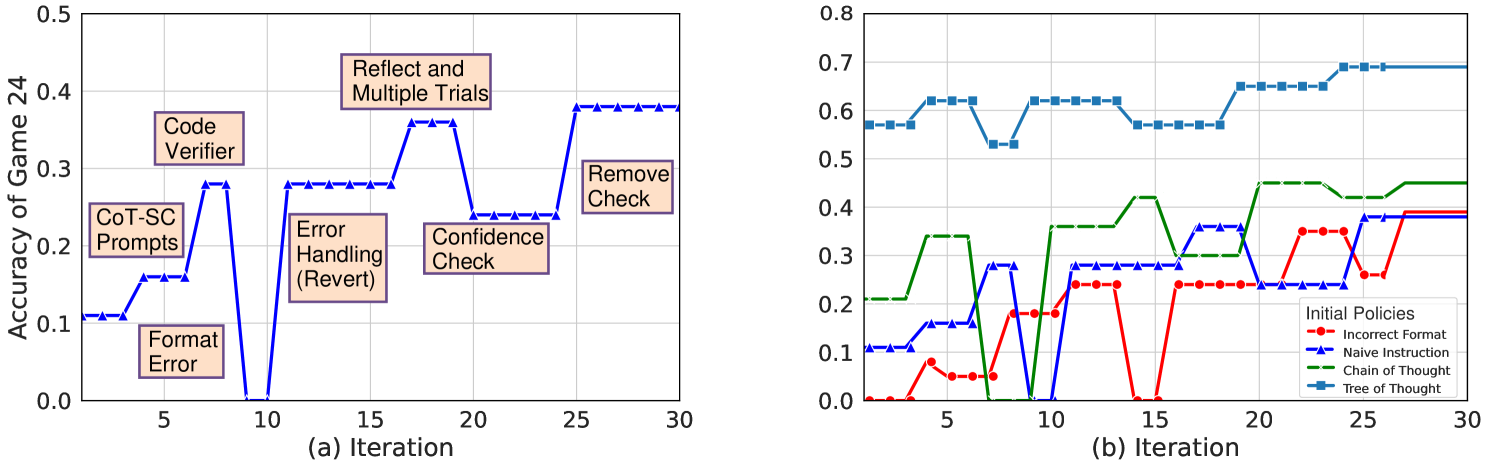
The image displays two side-by-side line charts, labeled (a) and (b), plotting the "Accuracy of Game 24" against "Iteration" (from 0 to 30). Chart (a) shows a single data series with annotated text boxes marking specific events or interventions. Chart (b) compares the performance of four different "Initial Policies" over the same iteration range.
### Components/Axes
**Common Elements:**
* **X-Axis (Both Charts):** Labeled "Iteration". Major tick marks at 0, 5, 10, 15, 20, 25, 30.
* **Y-Axis (Chart a):** Labeled "Accuracy of Game 24". Scale from 0.0 to 0.5, with major ticks at 0.1 intervals.
* **Y-Axis (Chart b):** Unlabeled, but context implies it is also "Accuracy of Game 24". Scale from 0.0 to 0.8, with major ticks at 0.1 intervals.
* **Grid:** Both charts have a light gray grid for both axes.
**Chart (a) Specifics:**
* **Data Series:** A single blue line with upward-pointing triangle markers.
* **Annotations (Text Boxes):** Seven peach-colored boxes with black borders, placed near specific points on the line. Their text and approximate positions are:
1. "CoT-SC Prompts" (Near iteration 2-3, accuracy ~0.11)
2. "Format Error" (Near iteration 5, accuracy ~0.16)
3. "Code Verifier" (Near iteration 7, accuracy ~0.28)
4. "Error Handling (Revert)" (Near iteration 12, accuracy ~0.28)
5. "Reflect and Multiple Trials" (Near iteration 17, accuracy ~0.36)
6. "Confidence Check" (Near iteration 20, accuracy ~0.24)
7. "Remove Check" (Near iteration 25, accuracy ~0.38)
**Chart (b) Specifics:**
* **Legend:** Located in the bottom-right corner. Title: "Initial Policies". Entries:
* Red line with circle markers: "Incorrect Format"
* Blue line with upward-pointing triangle markers: "Naïve Instruction"
* Green dashed line: "Chain of Thought"
* Blue line with square markers: "Tree of Thought"
* **Data Series:** Four distinct lines corresponding to the legend.
### Detailed Analysis
**Chart (a): Single Series with Annotations**
* **Trend Verification:** The line shows a generally increasing but highly volatile trend. It starts low (~0.11), experiences sharp drops (e.g., to 0.0 at iteration 10), and recovers to end at its highest point (~0.38).
* **Data Points (Approximate):**
* Iteration 0-2: ~0.11
* Iteration 5: ~0.16 (after "Format Error")
* Iteration 7: ~0.28 (peak after "Code Verifier")
* Iteration 10: 0.0 (sharp drop)
* Iteration 12: ~0.28 (recovery after "Error Handling (Revert)")
* Iteration 17: ~0.36 (peak after "Reflect and Multiple Trials")
* Iteration 20: ~0.24 (drop after "Confidence Check")
* Iteration 25-30: ~0.38 (plateau after "Remove Check")
**Chart (b): Comparison of Four Policies**
* **Trend Verification & Data Points (Approximate):**
1. **Tree of Thought (Blue squares):** Consistently the highest-performing policy. Starts at ~0.57, fluctuates between 0.53-0.63 until iteration 20, then rises to plateau at ~0.69 from iteration 25 onward.
2. **Chain of Thought (Green dashed):** Second-highest. Starts at ~0.21, shows a stepwise increase with significant jumps around iterations 5, 10, and 20, ending at ~0.45.
3. **Naïve Instruction (Blue triangles):** Starts at ~0.11, shows moderate improvement with high volatility, including a drop to 0.0 at iteration 10. Ends at ~0.39.
4. **Incorrect Format (Red circles):** Generally the lowest-performing. Starts at 0.0, shows sporadic improvement with peaks around ~0.35 (iteration 22) but also drops to 0.0 (iteration 15). Ends at ~0.39, converging with Naïve Instruction.
### Key Observations
1. **Volatility in Chart (a):** The single series in chart (a) is extremely sensitive to the annotated interventions, with some ("Format Error", "Confidence Check") causing severe performance drops, while others ("Code Verifier", "Remove Check") lead to improvements.
2. **Clear Hierarchy in Chart (b):** There is a distinct and consistent performance hierarchy: Tree of Thought > Chain of Thought > Naïve Instruction ≈ Incorrect Format (by the end).
3. **Convergence at the End:** In chart (b), the two lower-performing policies (Naïve Instruction and Incorrect Format) converge to a similar final accuracy (~0.39), while the top two maintain a significant gap.
4. **Iteration 10 Drop:** Both charts show a significant performance drop at or around iteration 10. In chart (a), it's a drop to 0.0. In chart (b), the "Naïve Instruction" and "Incorrect Format" lines also hit 0.0 at this point.
### Interpretation
The data suggests an experimental study on improving an AI agent's performance on "Game 24" through iterative refinement and different prompting strategies.
* **Chart (a) tells a narrative of intervention:** It likely tracks a single agent's journey where specific techniques (like adding a "Code Verifier" or "Reflect and Multiple Trials") are applied at certain iterations. The annotations act as milestones, showing that some methods are highly effective but unstable, while others (like "Remove Check") may lead to a stable, high-performance plateau. The sharp drops indicate points of catastrophic failure or reset within the process.
* **Chart (b) provides a comparative benchmark:** It evaluates four distinct initial prompting strategies ("policies") from the start. "Tree of Thought" demonstrates superior and more robust performance from the outset, suggesting that planning multiple reasoning paths is a highly effective strategy for this task. "Chain of Thought" is also effective but less so. The poor and volatile performance of "Incorrect Format" highlights the critical importance of output structure. The convergence of the two lower policies suggests a performance ceiling for simpler methods.
* **Underlying Pattern:** The overall upward trend in both charts indicates that iterative learning or refinement is generally beneficial, but the path is non-linear and fraught with setbacks. The comparison implies that starting with a more sophisticated reasoning policy (Tree of Thought) yields better long-term results than trying to iteratively improve a poor initial policy.