## Line Graphs: Accuracy Trends Across Iterations
### Overview
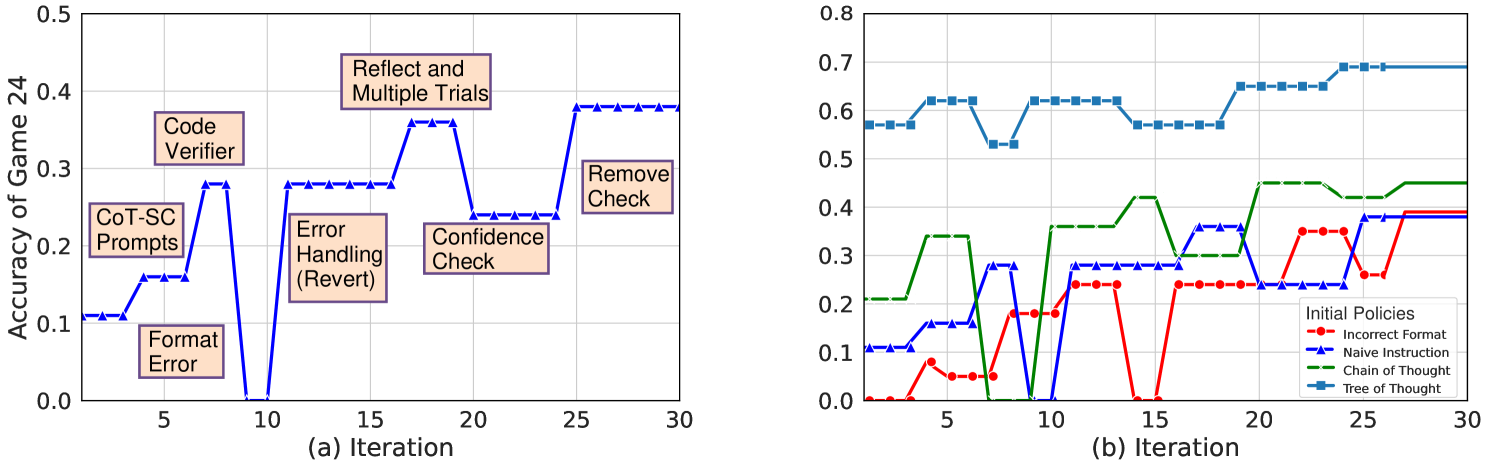
The image contains two line graphs (a) and (b) comparing the accuracy of different strategies or policies over iterations. Graph (a) focuses on iterative improvements in game accuracy, while graph (b) evaluates the performance of initial policies. Both graphs use iterations (0–30) on the x-axis and accuracy (0.0–0.8) on the y-axis.
---
### Components/Axes
#### Graph (a)
- **X-axis**: Iteration (0–30, integer steps).
- **Y-axis**: Accuracy of Game 24 (0.0–0.5, increments of 0.1).
- **Legend**:
- Code Verifier (blue line)
- CoT-SC Prompts (green line)
- Error Handling (Revert) (red line)
- Reflect and Multiple Trials (cyan line)
- Confidence Check (orange line)
- Remove Check (purple line)
- **Annotations**:
- "Code Verifier" (iteration 5)
- "CoT-SC Prompts" (iteration 5)
- "Error Handling (Revert)" (iteration 10)
- "Reflect and Multiple Trials" (iteration 15)
- "Confidence Check" (iteration 20)
- "Remove Check" (iteration 25)
#### Graph (b)
- **X-axis**: Iteration (0–30, integer steps).
- **Y-axis**: Accuracy (0.0–0.8, increments of 0.1).
- **Legend**:
- Incorrect Format (red line)
- Naive Instruction (blue line)
- Chain of Thought (green line)
- Tree of Thought (cyan line)
- **Annotations**: None explicitly labeled, but trends align with legend categories.
---
### Detailed Analysis
#### Graph (a)
1. **Code Verifier**:
- Starts at 0.1 (iteration 0), peaks at 0.3 (iteration 5), drops to 0.2 (iteration 10), then stabilizes at 0.3 (iteration 25–30).
2. **CoT-SC Prompts**:
- Starts at 0.1 (iteration 0), rises to 0.3 (iteration 5), drops to 0.1 (iteration 10), then stabilizes at 0.2 (iteration 25–30).
3. **Error Handling (Revert)**:
- Starts at 0.3 (iteration 0), plummets to 0.0 (iteration 10), rebounds to 0.3 (iteration 15–30).
4. **Reflect and Multiple Trials**:
- Starts at 0.3 (iteration 0), peaks at 0.4 (iteration 15), drops to 0.2 (iteration 20), then stabilizes at 0.3 (iteration 25–30).
5. **Confidence Check**:
- Starts at 0.2 (iteration 0), rises to 0.3 (iteration 15), drops to 0.2 (iteration 20), then stabilizes at 0.3 (iteration 25–30).
6. **Remove Check**:
- Starts at 0.2 (iteration 0), peaks at 0.4 (iteration 25), drops to 0.3 (iteration 30).
#### Graph (b)
1. **Incorrect Format**:
- Starts at 0.0 (iteration 0), peaks at 0.3 (iteration 5), drops to 0.1 (iteration 10), then stabilizes at 0.2 (iteration 25–30).
2. **Naive Instruction**:
- Starts at 0.1 (iteration 0), peaks at 0.3 (iteration 5), drops to 0.2 (iteration 10), then stabilizes at 0.3 (iteration 25–30).
3. **Chain of Thought**:
- Starts at 0.2 (iteration 0), peaks at 0.4 (iteration 5), drops to 0.3 (iteration 10), then stabilizes at 0.4 (iteration 25–30).
4. **Tree of Thought**:
- Starts at 0.6 (iteration 0), peaks at 0.7 (iteration 5), drops to 0.6 (iteration 10), then stabilizes at 0.7 (iteration 25–30).
---
### Key Observations
1. **Graph (a)**:
- Strategies like **Reflect and Multiple Trials** and **Remove Check** show the highest accuracy peaks (0.4).
- **Error Handling (Revert)** experiences a catastrophic drop to 0.0 at iteration 10 but recovers fully.
- **Code Verifier** and **CoT-SC Prompts** exhibit moderate but stable performance.
2. **Graph (b)**:
- **Tree of Thought** maintains the highest accuracy (0.7) throughout, despite a minor dip at iteration 10.
- **Chain of Thought** shows a sharp initial improvement (0.2 → 0.4) but plateaus.
- **Incorrect Format** performs poorly, peaking at 0.3 but dropping to 0.1 by iteration 10.
---
### Interpretation
1. **Graph (a)**:
- Iterative refinement of strategies (e.g., "Reflect and Multiple Trials") correlates with higher accuracy, suggesting that combining multiple approaches improves performance.
- The **Error Handling (Revert)** anomaly indicates a critical failure at iteration 10, possibly due to a flawed implementation or external factor.
- **Remove Check** achieves the highest peak (0.4) but drops slightly afterward, implying diminishing returns after a certain iteration.
2. **Graph (b)**:
- **Tree of Thought** outperforms all initial policies, maintaining near-optimal accuracy (0.7) despite minor fluctuations.
- **Chain of Thought** demonstrates strong initial gains but stabilizes at a lower level than Tree of Thought, suggesting it may require further optimization.
- **Incorrect Format** and **Naive Instruction** underperform, highlighting the importance of structured approaches.
---
### Spatial Grounding
- **Legend Placement**: Both graphs place legends in the top-right corner for clarity.
- **Annotations**: In graph (a), labels are positioned near their corresponding data points (e.g., "Code Verifier" at iteration 5). Graph (b) lacks explicit annotations but relies on legend alignment.
---
### Trend Verification
- **Graph (a)**: All lines show non-linear trends with peaks and troughs, consistent with iterative testing and adjustments.
- **Graph (b)**: Lines exhibit initial spikes followed by stabilization, reflecting policy evaluation over time.
---
### Content Details
- **Graph (a)**: Accuracy ranges from 0.0 (Error Handling failure) to 0.4 (Reflect and Multiple Trials/Remove Check peaks).
- **Graph (b)**: Accuracy ranges from 0.0 (Incorrect Format start) to 0.7 (Tree of Thought peak).
---
### Final Notes
- No non-English text is present. All labels and annotations are in English.
- Data points are extracted with approximate values based on visual alignment (e.g., 0.3 at iteration 5 for Code Verifier).