## Line Charts: Response Length vs Step and Train Reward vs Step
### Overview
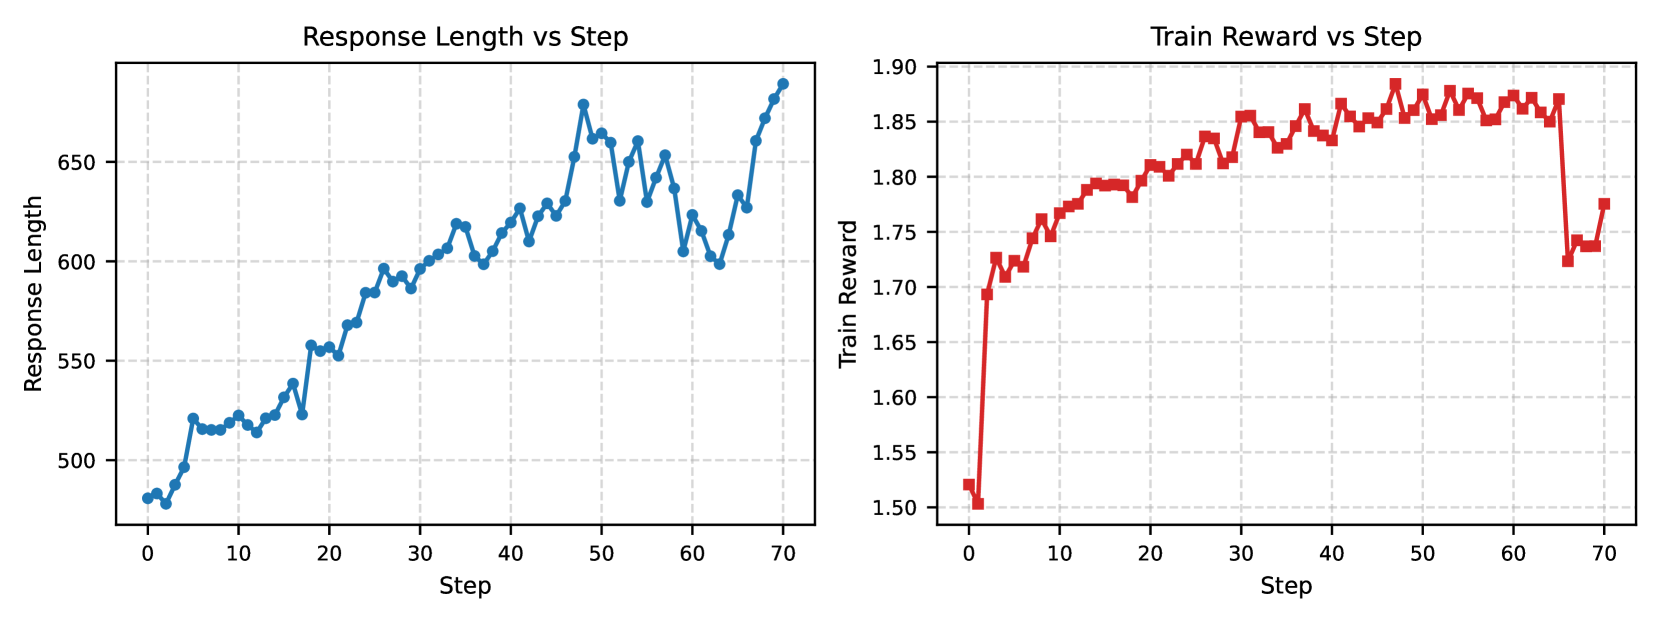
The image contains two line charts side-by-side. The left chart plots "Response Length" against "Step", and the right chart plots "Train Reward" against "Step". Both charts display data points connected by lines, showing how these metrics change over the course of training or some iterative process.
### Components/Axes
**Left Chart: Response Length vs Step**
* **Title:** Response Length vs Step
* **X-axis:**
* Label: Step
* Scale: 0 to 70, with tick marks at intervals of 10.
* **Y-axis:**
* Label: Response Length
* Scale: 500 to 650, with tick marks at intervals of 50.
* **Data Series:**
* Color: Blue
* Description: The line represents the response length at each step.
**Right Chart: Train Reward vs Step**
* **Title:** Train Reward vs Step
* **X-axis:**
* Label: Step
* Scale: 0 to 70, with tick marks at intervals of 10.
* **Y-axis:**
* Label: Train Reward
* Scale: 1.50 to 1.90, with tick marks at intervals of 0.05.
* **Data Series:**
* Color: Red
* Description: The line represents the train reward at each step.
### Detailed Analysis
**Left Chart: Response Length vs Step**
* **Trend:** The blue line generally slopes upward, indicating an increase in response length as the step increases.
* **Data Points:**
* Step 0: Response Length ≈ 480
* Step 10: Response Length ≈ 520
* Step 20: Response Length ≈ 560
* Step 30: Response Length ≈ 600
* Step 40: Response Length ≈ 620
* Step 50: Response Length ≈ 660
* Step 60: Response Length ≈ 600
* Step 70: Response Length ≈ 680
**Right Chart: Train Reward vs Step**
* **Trend:** The red line initially increases rapidly, then plateaus, and finally decreases sharply towards the end.
* **Data Points:**
* Step 0: Train Reward ≈ 1.52
* Step 10: Train Reward ≈ 1.78
* Step 20: Train Reward ≈ 1.82
* Step 30: Train Reward ≈ 1.85
* Step 40: Train Reward ≈ 1.87
* Step 50: Train Reward ≈ 1.88
* Step 60: Train Reward ≈ 1.86
* Step 70: Train Reward ≈ 1.74
### Key Observations
* The response length generally increases with the step, although there are fluctuations.
* The train reward increases rapidly at the beginning, plateaus in the middle, and then drops significantly at the end.
### Interpretation
The charts suggest that as the training progresses (indicated by the "Step"), the response length tends to increase. This could mean the model is generating longer outputs over time. The train reward, however, shows a different pattern. It initially improves rapidly, indicating successful learning, but then plateaus, suggesting diminishing returns. The sharp drop at the end could indicate overfitting or some other issue that negatively impacts the model's performance. The relationship between response length and train reward is not directly clear from these charts alone, but it suggests that simply increasing response length does not necessarily correlate with improved reward.