\n
## Charts: Training Performance Metrics
### Overview
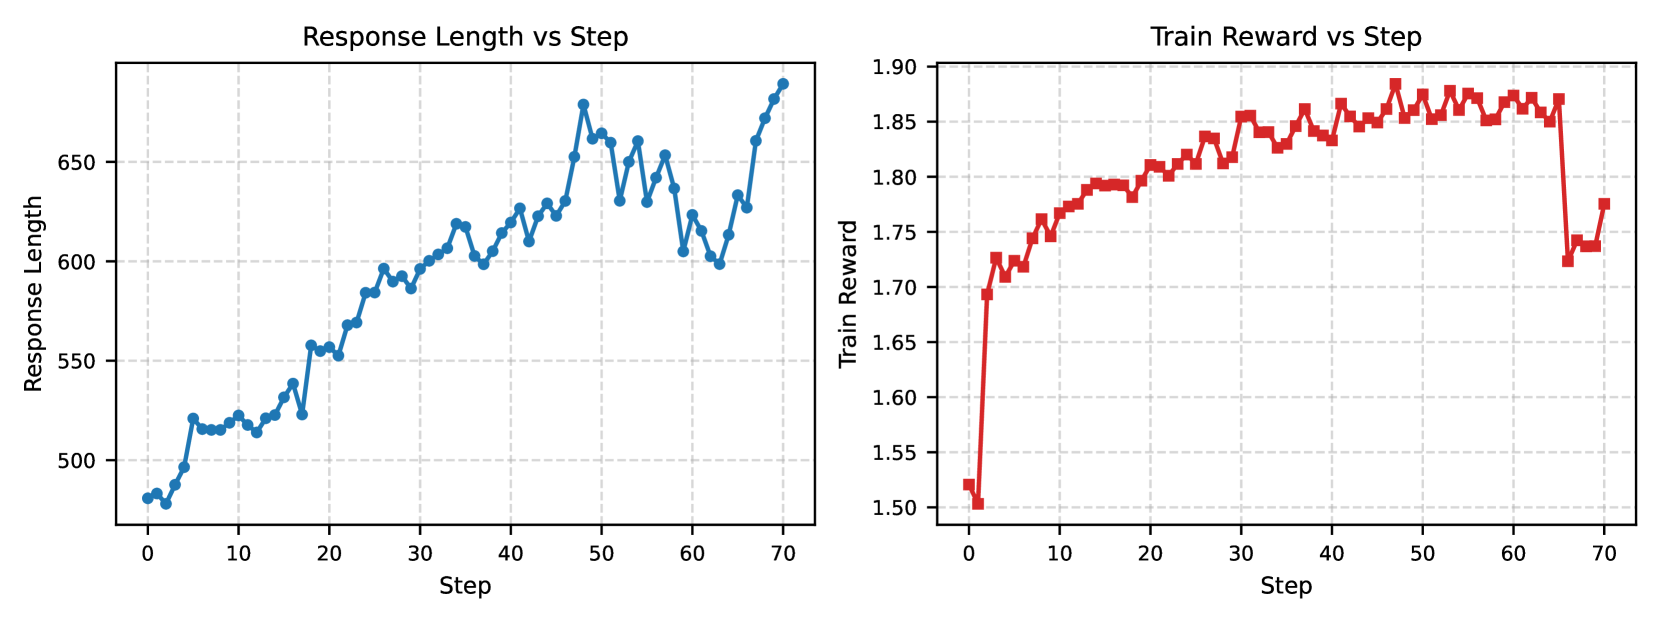
The image presents two line charts displaying training performance metrics over 70 steps. The left chart shows the relationship between 'Response Length' and 'Step', while the right chart illustrates the 'Train Reward' versus 'Step'. Both charts share the same x-axis scale, representing the training step.
### Components/Axes
**Chart 1: Response Length vs Step**
* **Title:** Response Length vs Step
* **X-axis:** Step (Scale: 0 to 70, increments of approximately 5)
* **Y-axis:** Response Length (Scale: 480 to 680, increments of approximately 50)
* **Data Series:** A single blue line representing Response Length.
**Chart 2: Train Reward vs Step**
* **Title:** Train Reward vs Step
* **X-axis:** Step (Scale: 0 to 70, increments of approximately 5)
* **Y-axis:** Train Reward (Scale: 1.50 to 1.90, increments of approximately 0.05)
* **Data Series:** A single red line representing Train Reward.
### Detailed Analysis or Content Details
**Chart 1: Response Length vs Step**
The blue line representing Response Length exhibits an overall upward trend, indicating that the response length generally increases with each step.
* Step 0: Response Length ≈ 490
* Step 10: Response Length ≈ 530
* Step 20: Response Length ≈ 570
* Step 30: Response Length ≈ 600
* Step 40: Response Length ≈ 640
* Step 50: Response Length ≈ 670, with a peak around 680
* Step 60: Response Length ≈ 650
* Step 70: Response Length ≈ 680
The line fluctuates, showing periods of rapid increase followed by plateaus or slight decreases.
**Chart 2: Train Reward vs Step**
The red line representing Train Reward initially increases, then plateaus, and finally shows a slight decrease towards the end of the training process.
* Step 0: Train Reward ≈ 1.51
* Step 10: Train Reward ≈ 1.72
* Step 20: Train Reward ≈ 1.82
* Step 30: Train Reward ≈ 1.86
* Step 40: Train Reward ≈ 1.87
* Step 50: Train Reward ≈ 1.86
* Step 60: Train Reward ≈ 1.82
* Step 70: Train Reward ≈ 1.74
The reward reaches a peak around Step 40 and then gradually declines.
### Key Observations
* Response Length consistently increases over the 70 steps, suggesting the model is learning to generate longer responses.
* Train Reward initially improves but plateaus and then slightly decreases, indicating potential overfitting or diminishing returns from further training.
* The fluctuations in Response Length suggest the model's response generation is not entirely stable.
* The plateau in Train Reward after Step 30 suggests the model has reached a point where further training yields minimal improvement.
### Interpretation
The data suggests that the model is successfully learning to generate longer responses during training. However, the plateau and subsequent decline in Train Reward indicate that the model may be approaching a point of diminishing returns or overfitting. The increasing response length without a corresponding increase in reward could indicate that the model is generating longer responses that are not necessarily more valuable or relevant. Further investigation is needed to determine the cause of the reward decline and to explore strategies for improving the model's performance, such as regularization or early stopping. The relationship between response length and reward could be further analyzed to understand if there is an optimal response length that maximizes reward.