## Line Charts: Response Length vs Step and Train Reward vs Step
### Overview
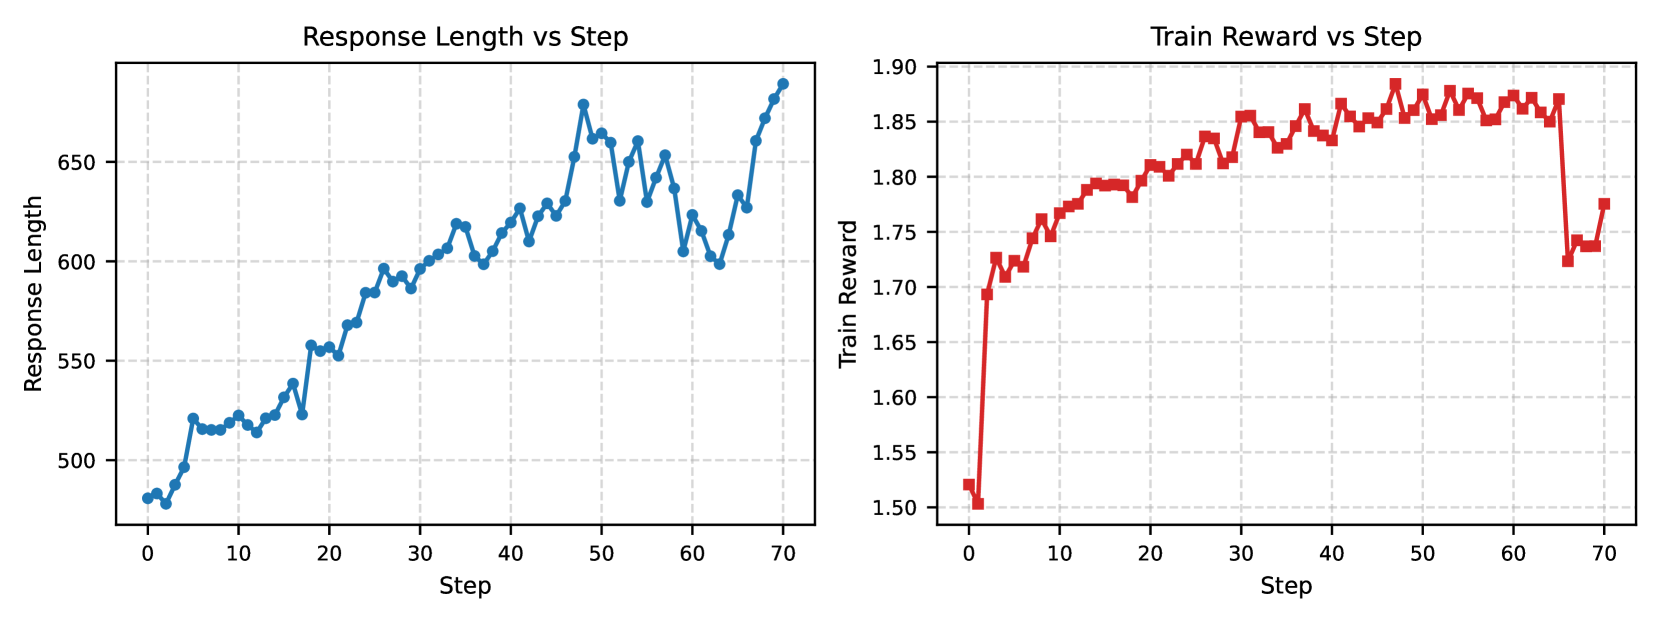
Two line charts are presented side by side. The left chart tracks "Response Length" (y-axis) against "Step" (x-axis), while the right chart tracks "Train Reward" (y-axis) against "Step" (x-axis). Both charts use grid lines for reference and display stepwise progression.
### Components/Axes
- **Left Chart ("Response Length vs Step")**:
- **X-axis (Step)**: Integer values from 0 to 70, labeled "Step."
- **Y-axis (Response Length)**: Continuous values from 450 to 700, labeled "Response Length."
- **Data Series**: A single blue line representing response length over steps.
- **Legend**: Blue color corresponds to the response length data.
- **Right Chart ("Train Reward vs Step")**:
- **X-axis (Step)**: Integer values from 0 to 70, labeled "Step."
- **Y-axis (Train Reward)**: Continuous values from 1.50 to 1.90, labeled "Train Reward."
- **Data Series**: A single red line representing train reward over steps.
- **Legend**: Red color corresponds to the train reward data.
### Detailed Analysis
#### Left Chart ("Response Length vs Step"):
- **Trend**: The blue line shows a general upward trend with fluctuations.
- **Initial Phase (Steps 0–20)**: Response length starts at ~475, rises steadily to ~550 by step 20.
- **Mid-Phase (Steps 20–50)**: Fluctuates between ~550 and ~650, peaking at ~680 around step 50.
- **Final Phase (Steps 50–70)**: Stabilizes between ~600 and ~680, ending near ~680 at step 70.
- **Key Data Points**:
- Step 0: ~475
- Step 20: ~550
- Step 50: ~680
- Step 70: ~680
#### Right Chart ("Train Reward vs Step"):
- **Trend**: The red line exhibits rapid growth, plateauing, and a sharp decline.
- **Initial Phase (Steps 0–10)**: Train reward jumps from 1.50 to ~1.70 by step 5, then stabilizes near 1.75 by step 10.
- **Mid-Phase (Steps 10–60)**: Gradually increases to ~1.85–1.88, peaking at ~1.88 around step 45.
- **Final Phase (Steps 60–70)**: Drops sharply to ~1.70 at step 65, then recovers to ~1.75 by step 70.
- **Key Data Points**:
- Step 0: 1.50
- Step 5: ~1.70
- Step 20: ~1.80
- Step 45: ~1.88
- Step 65: ~1.70
- Step 70: ~1.75
### Key Observations
1. **Response Length**:
- Shows consistent growth with minor fluctuations, suggesting incremental improvements over steps.
- No significant drops, indicating stability in the measured metric.
2. **Train Reward**:
- Sharp initial improvement, followed by a plateau and a sudden drop near the end.
- The final decline (step 65–70) is an outlier, deviating from the earlier upward trend.
3. **Correlation**:
- Both metrics generally increase over time, but the train reward’s drop at step 65 does not align with the response length’s stability, suggesting potential decoupling or external factors.
### Interpretation
- **Response Length**: The steady increase may reflect expanding model complexity or output size, though the metric’s exact definition (e.g., tokens, layers) is unclear.
- **Train Reward**: The initial rise indicates effective learning, but the final drop could signal overfitting, data degradation, or a bug introduced late in training.
- **Relationship**: While both metrics trend upward, their divergence in the final steps highlights a disconnect. The train reward’s sensitivity to later steps suggests it may be more vulnerable to training instability or data quality issues.
### Notable Anomalies
- **Train Reward Drop (Step 65–70)**: A 15% decline from the peak (~1.88 to ~1.70) warrants investigation. Possible causes include:
- Overfitting to noisy data in later steps.
- A sudden change in input distribution.
- Model architecture adjustments (e.g., layer pruning).
This analysis underscores the importance of monitoring both performance metrics and response characteristics during training to diagnose and address instability.