## Bar Chart: Task Complexity vs. Parallelism, Tool Calls, and Candidate Tools
### Overview
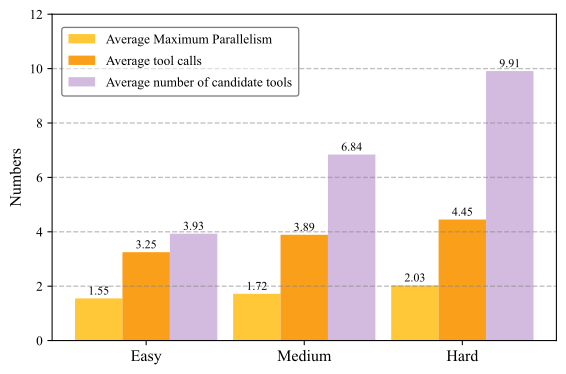
The image is a bar chart comparing three metrics – Average Maximum Parallelism, Average Tool Calls, and Average Number of Candidate Tools – across three levels of task complexity: Easy, Medium, and Hard. The chart uses different colored bars to represent each metric, with values displayed above each bar.
### Components/Axes
* **Y-axis:** "Numbers," ranging from 0 to 12, with gridlines at intervals of 2.
* **X-axis:** Task complexity levels: "Easy," "Medium," and "Hard."
* **Legend (top-left):**
* Yellow: "Average Maximum Parallelism"
* Orange: "Average tool calls"
* Lavender: "Average number of candidate tools"
### Detailed Analysis
Here's a breakdown of the data for each task complexity level:
* **Easy:**
* Average Maximum Parallelism (Yellow): 1.55
* Average Tool Calls (Orange): 3.25
* Average Number of Candidate Tools (Lavender): 3.93
* **Medium:**
* Average Maximum Parallelism (Yellow): 1.72
* Average Tool Calls (Orange): 3.89
* Average Number of Candidate Tools (Lavender): 6.84
* **Hard:**
* Average Maximum Parallelism (Yellow): 2.03
* Average Tool Calls (Orange): 4.45
* Average Number of Candidate Tools (Lavender): 9.91
### Key Observations
* All three metrics increase as task complexity increases from Easy to Hard.
* The Average Number of Candidate Tools (Lavender) shows the most significant increase with task complexity.
* The Average Maximum Parallelism (Yellow) shows the least increase with task complexity.
### Interpretation
The chart suggests that as tasks become more complex, the system requires more candidate tools to consider and makes more tool calls. The increase in Average Maximum Parallelism is relatively smaller, indicating that the potential for parallelism doesn't increase as dramatically as the number of tools and calls. This could imply that the system relies more on exploring different tool options and sequences rather than simply executing more tasks in parallel to handle complex tasks. The large increase in candidate tools suggests that the system needs to explore a wider range of options to find the right approach for harder tasks.