# Technical Data Extraction: Tool Usage Metrics by Difficulty
## 1. Image Overview
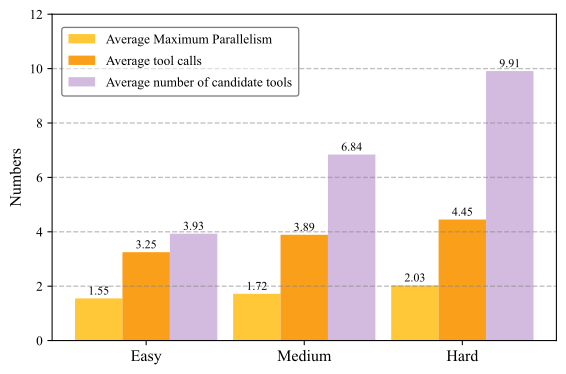
This image is a grouped bar chart illustrating three different metrics related to computational tool usage, categorized by task difficulty levels: **Easy**, **Medium**, and **Hard**.
## 2. Component Isolation
### A. Header / Legend
* **Location:** Top-left quadrant of the chart area.
* **Legend Items:**
* **Light Yellow (#FFCC33):** Average Maximum Parallelism
* **Orange (#F9A61A):** Average tool calls
* **Light Purple (#D1BBD7):** Average number of candidate tools
### B. Main Chart Area (Axes)
* **Y-Axis Label:** "Numbers"
* **Y-Axis Scale:** Linear, ranging from 0 to 12 with major tick marks and dashed horizontal grid lines at intervals of 2 (0, 2, 4, 6, 8, 10, 12).
* **X-Axis Categories:** Three discrete categories representing difficulty: "Easy", "Medium", and "Hard".
### C. Data Series Trends
* **Average Maximum Parallelism (Yellow):** Shows a slight upward trend as difficulty increases (1.55 $\rightarrow$ 1.72 $\rightarrow$ 2.03).
* **Average tool calls (Orange):** Shows a steady upward trend as difficulty increases (3.25 $\rightarrow$ 3.89 $\rightarrow$ 4.45).
* **Average number of candidate tools (Purple):** Shows a significant, non-linear upward trend, nearly tripling from Easy to Hard (3.93 $\rightarrow$ 6.84 $\rightarrow$ 9.91).
## 3. Data Table Reconstruction
The following table represents the precise numerical values labeled atop each bar in the chart.
| Difficulty | Average Maximum Parallelism (Yellow) | Average tool calls (Orange) | Average number of candidate tools (Purple) |
| :--- | :---: | :---: | :---: |
| **Easy** | 1.55 | 3.25 | 3.93 |
| **Medium** | 1.72 | 3.89 | 6.84 |
| **Hard** | 2.03 | 4.45 | 9.91 |
## 4. Detailed Technical Analysis
* **Complexity Correlation:** There is a positive correlation between task difficulty and all three measured metrics.
* **Primary Driver of Difficulty:** The "Average number of candidate tools" is the most volatile metric, increasing by approximately 152% from Easy to Hard. This suggests that "Hard" tasks are characterized primarily by a much larger search space of potential tools.
* **Parallelism Stability:** While parallelism increases, it remains the most stable metric, suggesting that even as tasks become harder and require more tool calls, the ability to execute those calls in parallel grows at a much slower rate than the total volume of tools or calls required.
* **Visual Note:** The chart uses dashed horizontal grid lines to assist in value estimation, though exact values are provided as text labels above each bar for precision.