## Grouped Bar Chart: Performance Metrics by Task Difficulty
### Overview
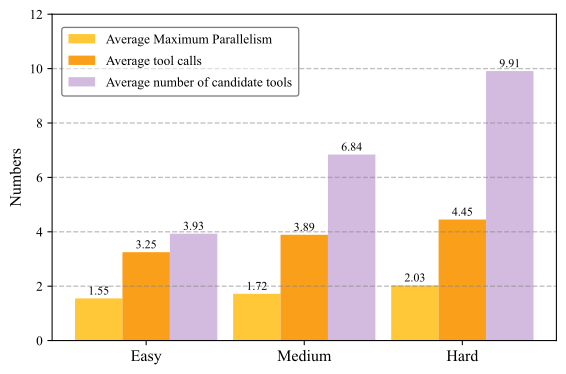
This is a grouped bar chart comparing three performance metrics across three task difficulty levels: Easy, Medium, and Hard. The chart illustrates how resource usage and complexity scale with increasing task difficulty.
### Components/Axes
* **Chart Type:** Grouped Bar Chart.
* **X-Axis (Horizontal):** Represents task difficulty. The categories are, from left to right: **Easy**, **Medium**, **Hard**.
* **Y-Axis (Vertical):** Labeled **"Numbers"**. The scale runs from 0 to 12, with major gridlines at intervals of 2 (0, 2, 4, 6, 8, 10, 12).
* **Legend:** Located in the top-left corner of the chart area. It defines three data series:
* **Yellow Bar:** "Average Maximum Parallelism"
* **Orange Bar:** "Average tool calls"
* **Light Purple Bar:** "Average number of candidate tools"
* **Data Labels:** Each bar has its exact numerical value displayed directly above it.
### Detailed Analysis
The data is grouped by difficulty level. For each level, the three metrics are presented as adjacent bars.
**1. Easy Difficulty:**
* **Average Maximum Parallelism (Yellow):** 1.55
* **Average tool calls (Orange):** 3.25
* **Average number of candidate tools (Purple):** 3.93
* *Visual Trend:* All values are the lowest on the chart. The purple bar (candidate tools) is the tallest within this group.
**2. Medium Difficulty:**
* **Average Maximum Parallelism (Yellow):** 1.72
* **Average tool calls (Orange):** 3.89
* **Average number of candidate tools (Purple):** 6.84
* *Visual Trend:* All metrics show an increase from the Easy level. The purple bar shows a significant jump, becoming much taller than the other two bars in this group.
**3. Hard Difficulty:**
* **Average Maximum Parallelism (Yellow):** 2.03
* **Average tool calls (Orange):** 4.45
* **Average number of candidate tools (Purple):** 9.91
* *Visual Trend:* All metrics reach their peak values. The purple bar (candidate tools) is the tallest bar in the entire chart, showing a steep, near-linear increase from Easy to Hard.
### Key Observations
1. **Consistent Upward Trend:** All three metrics increase monotonically from Easy to Hard difficulty.
2. **Disproportionate Growth of Candidate Tools:** The "Average number of candidate tools" (purple) exhibits the most dramatic growth. Its value increases by approximately **152%** from Easy (3.93) to Hard (9.91), while the other metrics grow by roughly **31%** (Parallelism) and **37%** (Tool Calls).
3. **Relative Metric Order:** Within each difficulty group, the order of magnitude is consistent: `Average Maximum Parallelism < Average tool calls < Average number of candidate tools`.
4. **Parallelism Growth is Modest:** The "Average Maximum Parallelism" shows the smallest absolute and relative increase, suggesting that the capacity for parallel execution does not scale as aggressively with task difficulty as the other measured factors.
### Interpretation
The data suggests a clear relationship between task difficulty and the computational resources or complexity required to solve it.
* **Complexity Scaling:** The sharp rise in the "Average number of candidate tools" indicates that harder tasks require the system to consider a much larger set of potential actions or solutions. This is the primary driver of increased complexity.
* **Execution Overhead:** The moderate increase in "Average tool calls" reflects the additional steps or operations needed to navigate this larger solution space and complete the harder task.
* **Parallelism Constraint:** The relatively flat growth in "Average Maximum Parallelism" implies that the system's ability to execute tasks in parallel is somewhat constrained or does not need to increase proportionally. This could be due to inherent task dependencies, system architecture limits, or that parallelism is optimized for a baseline level of difficulty.
* **Implication for System Design:** The chart highlights that as tasks become harder, the challenge shifts significantly toward **managing and searching a larger candidate set** rather than simply executing more parallel operations. An efficient system for hard tasks would need strong mechanisms for pruning, ranking, and selecting from a wide array of candidate tools.