## Bar Chart: Task Difficulty Metrics
### Overview
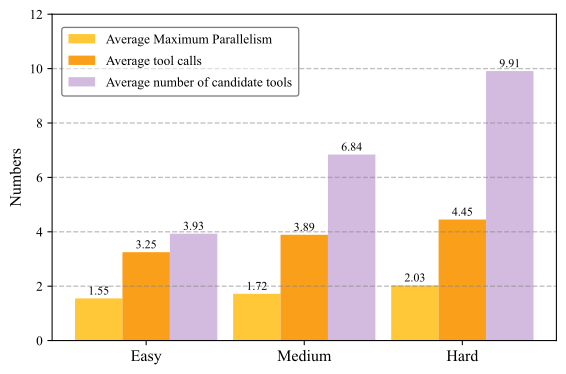
The chart compares three metrics across three task difficulty levels (Easy, Medium, Hard):
1. **Average Maximum Parallelism** (orange)
2. **Average tool calls** (yellow)
3. **Average number of candidate tools** (purple)
Values are normalized, with the y-axis ranging from 0 to 12. The hardest difficulty level shows the most significant increases across all metrics.
### Components/Axes
- **X-axis**: Task difficulty levels (Easy, Medium, Hard)
- **Y-axis**: Numerical values (0–12, increments of 2)
- **Legend**: Top-left corner, mapping colors to metrics:
- Orange = Average Maximum Parallelism
- Yellow = Average tool calls
- Purple = Average number of candidate tools
### Detailed Analysis
- **Easy**:
- Average Maximum Parallelism: 1.55 (orange)
- Average tool calls: 3.25 (yellow)
- Average number of candidate tools: 3.93 (purple)
- **Medium**:
- Average Maximum Parallelism: 1.72 (orange)
- Average tool calls: 3.89 (yellow)
- Average number of candidate tools: 6.84 (purple)
- **Hard**:
- Average Maximum Parallelism: 2.03 (orange)
- Average tool calls: 4.45 (yellow)
- Average number of candidate tools: 9.91 (purple)
### Key Observations
1. **Purple bars (candidate tools)** dominate all difficulty levels, increasing sharply with task complexity (3.93 → 9.91).
2. **Yellow bars (tool calls)** show moderate growth (3.25 → 4.45), suggesting increased tool usage but not proportional to candidate tools.
3. **Orange bars (parallelism)** exhibit minimal growth (1.55 → 2.03), indicating limited scalability of parallel execution despite higher difficulty.
### Interpretation
The data reveals a strong correlation between task difficulty and the number of candidate tools required, implying that harder tasks demand significantly more tool exploration. However, the stagnant growth in parallelism suggests that parallel execution efficiency does not scale with task complexity. This could indicate:
- **Tool saturation**: More tools are needed for harder tasks, but parallel execution remains constrained by system/resource limits.
- **Sequential dependencies**: Increased difficulty may introduce workflows where tools must be used sequentially rather than in parallel.
- **Optimization gaps**: The disparity between candidate tools and parallelism highlights opportunities to improve parallel execution strategies for complex tasks.
The chart underscores the need to investigate why parallelism lags behind tool availability as tasks become harder, potentially pointing to architectural or algorithmic bottlenecks.