## Line Chart: X-EcoMLA Performance vs. KV Cache Compression
### Overview
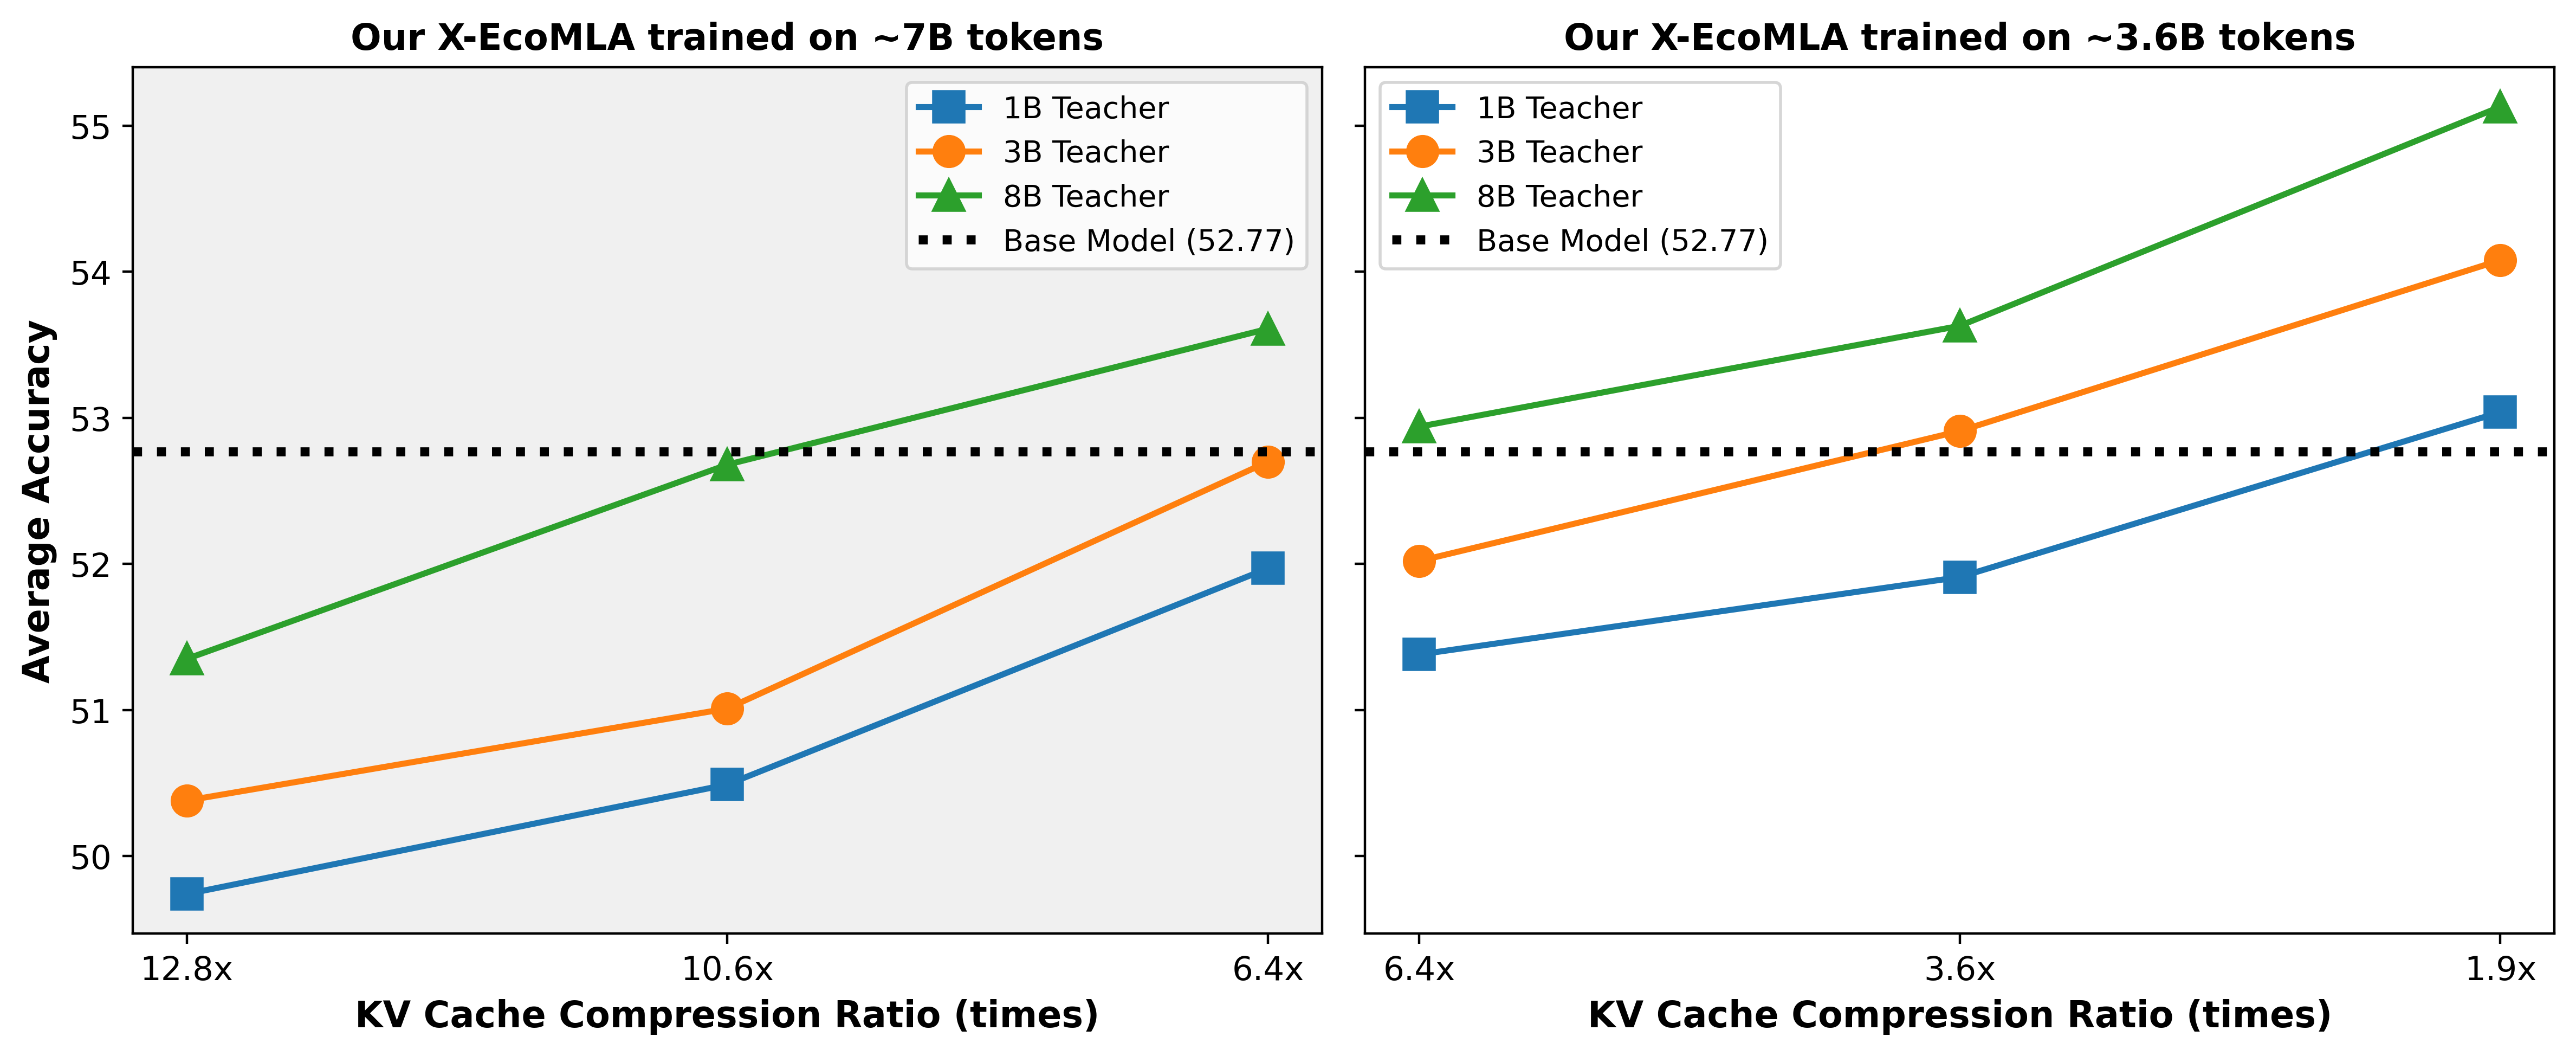
This image displays two side-by-side line charts comparing the "Average Accuracy" of "X-EcoMLA" models against "KV Cache Compression Ratio." The left chart represents models trained on ~7B tokens, while the right chart represents models trained on ~3.6B tokens. Both charts include a horizontal reference line indicating the performance of a "Base Model" at 52.77 accuracy.
### Components/Axes
* **Y-Axis:** "Average Accuracy," scaled from 50 to 55.
* **X-Axis (Left Chart):** "KV Cache Compression Ratio (times)," with values 12.8x, 10.6x, and 6.4x (ordered from highest compression to lowest).
* **X-Axis (Right Chart):** "KV Cache Compression Ratio (times)," with values 6.4x, 3.6x, and 1.9x (ordered from highest compression to lowest).
* **Legend (Top-Right of each chart):**
* **Blue Square:** 1B Teacher
* **Orange Circle:** 3B Teacher
* **Green Triangle:** 8B Teacher
* **Black Dotted Line:** Base Model (52.77)
### Detailed Analysis
#### Left Chart: Trained on ~7B tokens
* **Trend:** All three teacher models show a positive correlation between decreasing compression ratio (moving right on the x-axis) and increasing accuracy.
* **1B Teacher (Blue Square):**
* 12.8x: ~49.8
* 10.6x: ~50.5
* 6.4x: ~52.0
* **3B Teacher (Orange Circle):**
* 12.8x: ~50.4
* 10.6x: ~51.0
* 6.4x: ~52.7
* **8B Teacher (Green Triangle):**
* 12.8x: ~51.4
* 10.6x: ~52.7
* 6.4x: ~53.6
* **Base Model:** Constant at 52.77.
#### Right Chart: Trained on ~3.6B tokens
* **Trend:** All three teacher models show a positive correlation between decreasing compression ratio (moving right on the x-axis) and increasing accuracy.
* **1B Teacher (Blue Square):**
* 6.4x: ~51.4
* 3.6x: ~51.9
* 1.9x: ~53.0
* **3B Teacher (Orange Circle):**
* 6.4x: ~52.0
* 3.6x: ~52.9
* 1.9x: ~54.1
* **8B Teacher (Green Triangle):**
* 6.4x: ~52.9
* 3.6x: ~53.6
* 1.9x: ~55.1
* **Base Model:** Constant at 52.77.
### Key Observations
* **Compression Impact:** In both charts, higher compression ratios (larger "x" values) consistently result in lower average accuracy. As the compression ratio decreases (moving right), accuracy improves.
* **Teacher Model Efficacy:** Larger teacher models (8B) consistently outperform smaller teacher models (3B and 1B) at every compression level.
* **Base Model Threshold:**
* In the **7B token chart**, only the 8B teacher model manages to meet or exceed the Base Model (52.77) at 10.6x and 6.4x compression.
* In the **3.6B token chart**, the 3B and 8B teacher models exceed the Base Model at 3.6x and 1.9x compression. The 1B teacher model only exceeds the Base Model at the lowest compression ratio (1.9x).
### Interpretation
The data demonstrates that KV cache compression is a lossy process, but the performance degradation can be mitigated by using larger teacher models during training (knowledge distillation).
Interestingly, the models trained on ~3.6B tokens (right chart) appear to achieve higher absolute accuracy scores at similar compression ratios (e.g., 6.4x) compared to the models trained on ~7B tokens (left chart). This suggests that the training configuration or the specific compression ratios tested in the right chart are more optimal for maintaining accuracy. The "Base Model" acts as a performance ceiling; the goal of the X-EcoMLA training appears to be recovering as much of that base performance as possible while maximizing the compression ratio. The 8B teacher model is clearly the most robust, consistently providing the highest accuracy across all tested compression levels.