## Line Charts: X-EcoMLA Performance Across KV Cache Compression Ratios
### Overview
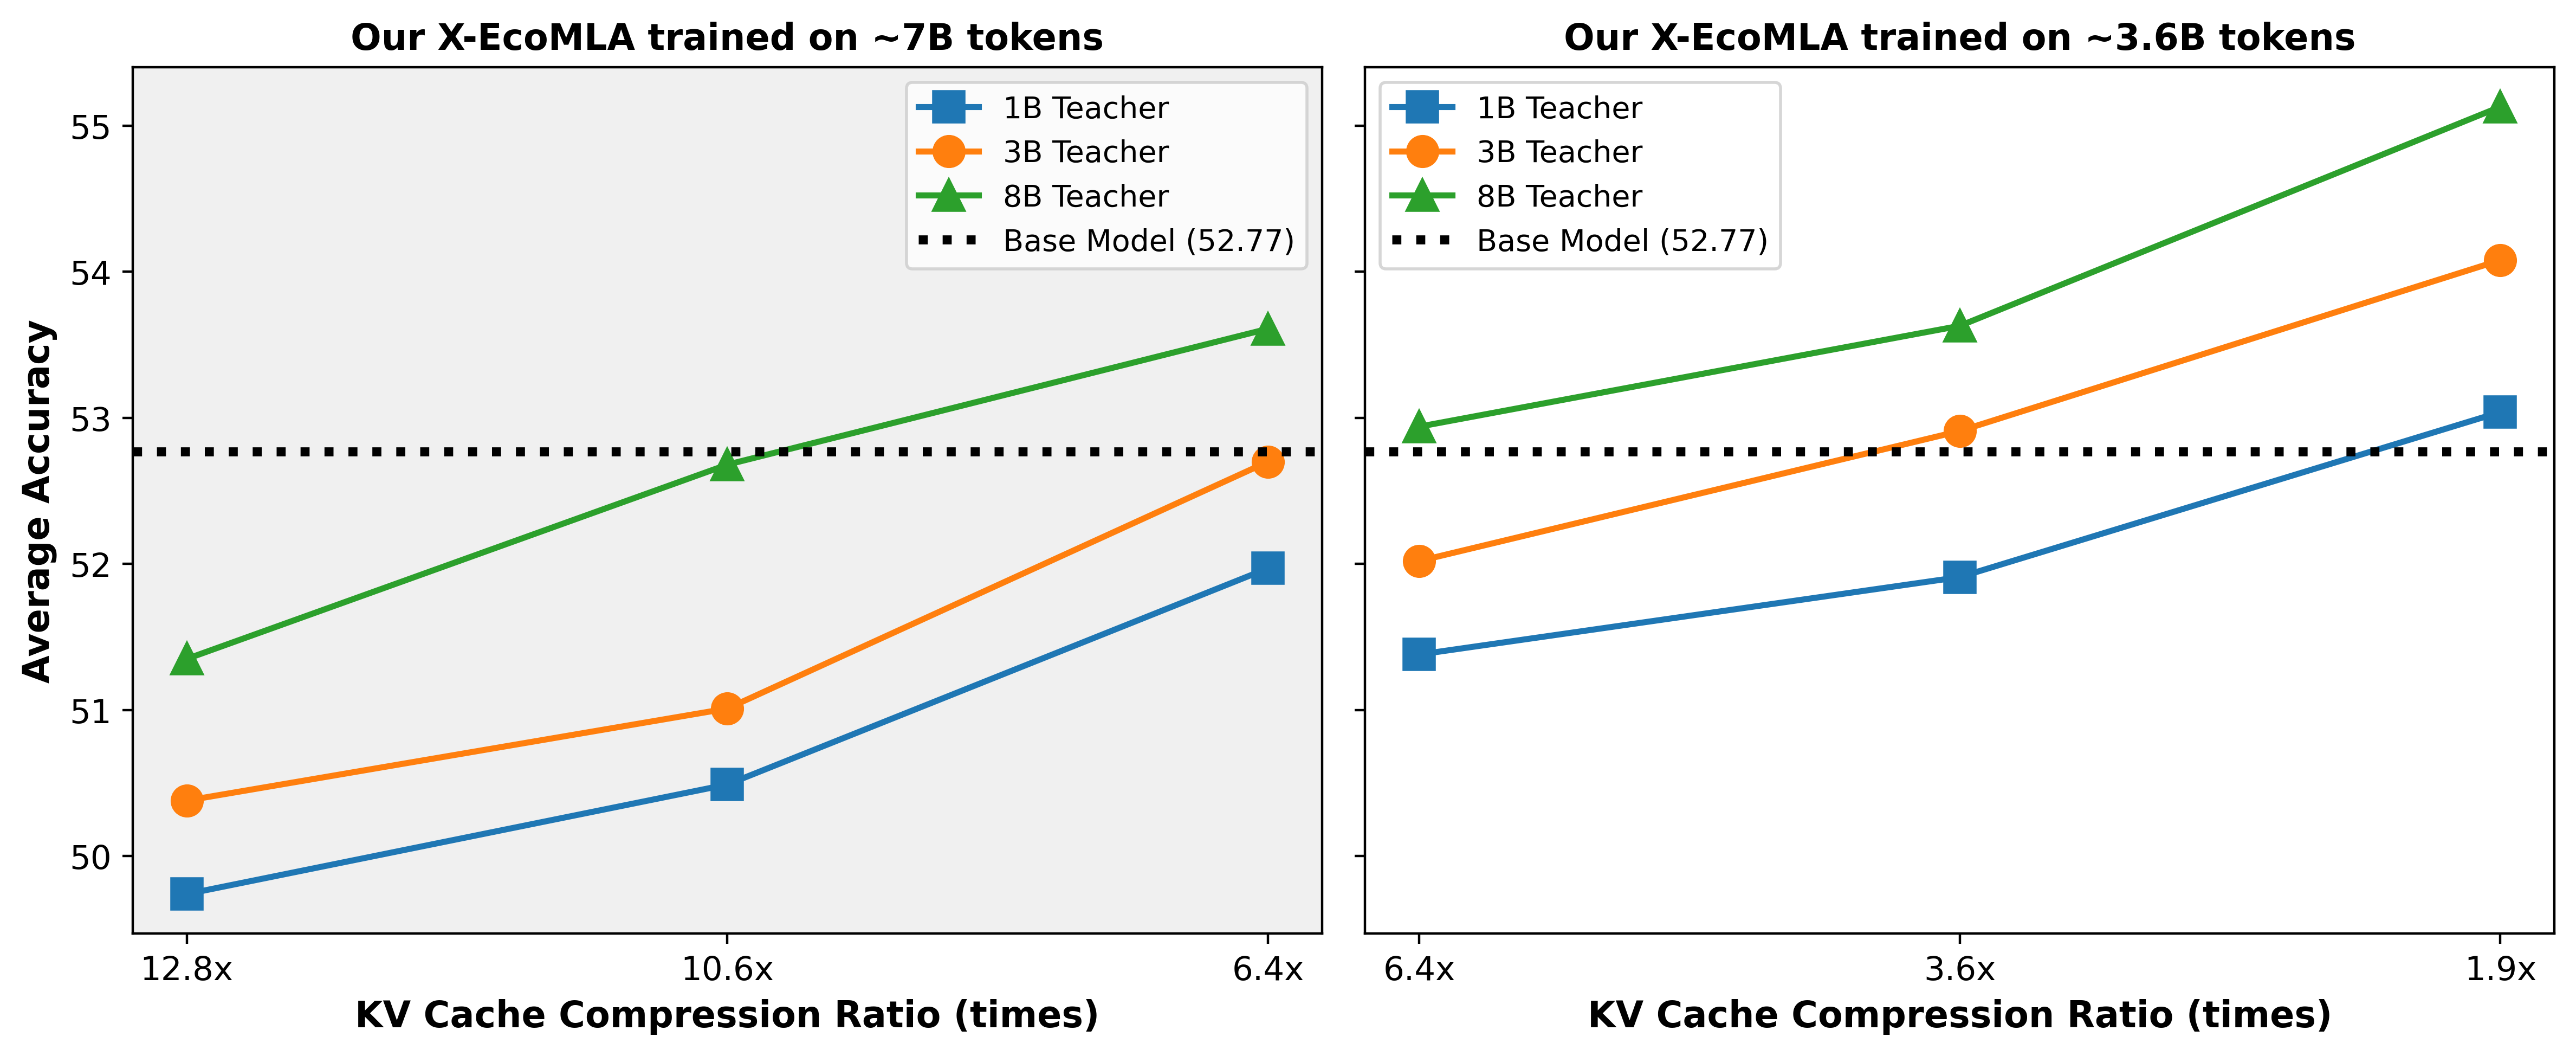
The image contains two line charts comparing the average accuracy of the X-EcoMLA model trained on different token volumes (~7B and ~3.6B) across varying KV cache compression ratios. Each chart includes three teacher-based models (1B, 3B, 8B parameters) and a baseline model (52.77 accuracy). The charts demonstrate how model performance scales with compression efficiency.
### Components/Axes
- **X-Axes (KV Cache Compression Ratio):**
- Left chart: 12.8x → 10.6x → 6.4x
- Right chart: 6.4x → 3.6x → 1.9x
- **Y-Axes (Average Accuracy):**
- Range: 50 → 55 (both charts)
- **Legends:**
- Left chart: Top-left position
- 1B Teacher (blue square)
- 3B Teacher (orange circle)
- 8B Teacher (green triangle)
- Base Model (dashed black line, 52.77)
- Right chart: Top-left position
- Same legend entries as left chart
- **Base Model Line:** Horizontal dashed black line at 52.77 in both charts
### Detailed Analysis
#### Left Chart (~7B Tokens)
1. **1B Teacher (blue squares):**
- 12.8x: ~49.8
- 10.6x: ~50.5
- 6.4x: ~52.0
2. **3B Teacher (orange circles):**
- 12.8x: ~50.4
- 10.6x: ~51.0
- 6.4x: ~52.7
3. **8B Teacher (green triangles):**
- 12.8x: ~51.3
- 10.6x: ~52.7
- 6.4x: ~53.6
4. **Base Model:** Constant at 52.77
#### Right Chart (~3.6B Tokens)
1. **1B Teacher (blue squares):**
- 6.4x: ~51.4
- 3.6x: ~51.9
- 1.9x: ~53.1
2. **3B Teacher (orange circles):**
- 6.4x: ~52.1
- 3.6x: ~52.9
- 1.9x: ~54.1
3. **8B Teacher (green triangles):**
- 6.4x: ~52.9
- 3.6x: ~53.6
- 1.9x: ~55.2
4. **Base Model:** Constant at 52.77
### Key Observations
1. **Upward Trends:** All models show improved accuracy as compression ratio decreases (higher efficiency).
2. **Model Size Correlation:** Larger teacher models (8B > 3B > 1B) consistently outperform smaller ones.
3. **Token Volume Paradox:** The ~3.6B token model achieves higher accuracy than the ~7B token model despite fewer training tokens.
4. **Base Model Benchmark:** All models surpass the baseline (52.77) except the 1B Teacher at 12.8x compression.
### Interpretation
1. **Scaling Efficiency:** The 8B Teacher demonstrates superior compression resilience, maintaining ~55.2 accuracy at 1.9x compression (right chart), suggesting larger models better leverage compressed representations.
2. **Token Quality vs. Quantity:** The ~3.6B token model's higher performance implies training data quality or architectural efficiency may outweigh raw token volume in this context.
3. **Compression Sweet Spot:** The 6.4x-3.6x range shows the most significant accuracy gains across all models, indicating optimal balance between compression and performance.
4. **Baseline Significance:** The 52.77 baseline represents a critical threshold – all models except the smallest at extreme compression (12.8x) achieve meaningful improvements.
This analysis reveals that model architecture (teacher size) and training data efficiency (token quality) are more critical than raw data volume for X-EcoMLA's performance under compression constraints.