## Scatter Plot: A-mem vs Base
### Overview
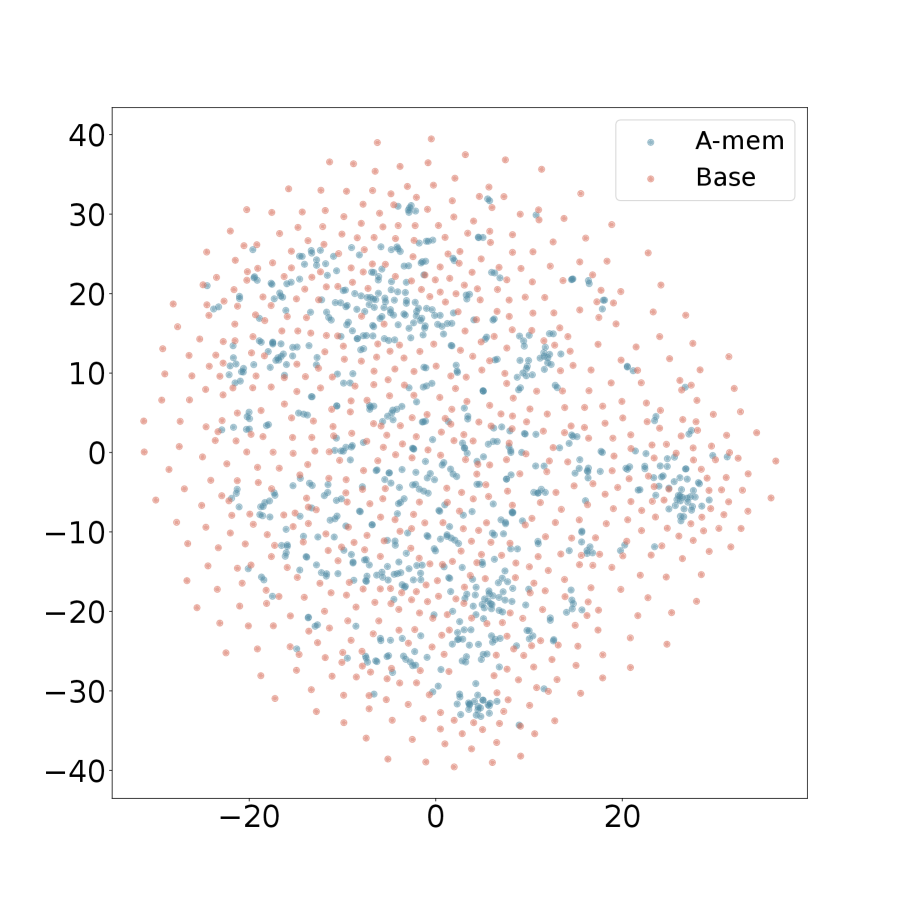
The image is a scatter plot comparing two datasets, labeled "A-mem" and "Base". The plot displays the distribution of data points for each dataset across a two-dimensional space. The x and y axes range from approximately -25 to 25 and -40 to 40, respectively.
### Components/Axes
* **X-axis:** Ranges from -20 to 20, with tick marks at -20 and 0 and 20.
* **Y-axis:** Ranges from -40 to 40, with tick marks at -40, -30, -20, -10, 0, 10, 20, 30, and 40.
* **Legend:** Located in the top-right corner.
* "A-mem" is represented by light blue dots.
* "Base" is represented by light red dots.
### Detailed Analysis
* **A-mem (Light Blue):** The light blue dots are scattered throughout the plot, with higher concentrations in certain areas, such as around (-5, -30), (10, -5), and (-5, 20).
* **Base (Light Red):** The light red dots are also scattered throughout the plot, generally appearing more uniformly distributed compared to the "A-mem" data.
* **Distribution:** Both datasets appear to be centered around the origin (0, 0), with data points spreading out in all directions.
### Key Observations
* The "A-mem" data appears to have some clustering, while the "Base" data is more evenly distributed.
* There is significant overlap between the two datasets, indicating some degree of similarity in their distributions.
* The range of both datasets is approximately the same, spanning from -25 to 25 on the x-axis and -40 to 40 on the y-axis.
### Interpretation
The scatter plot visualizes the distribution of two datasets, "A-mem" and "Base," in a two-dimensional space. The clustering observed in the "A-mem" data suggests that there may be underlying patterns or groupings within that dataset. The more uniform distribution of the "Base" data indicates a lack of such distinct patterns. The overlap between the two datasets suggests that they share some common characteristics, but the differences in their distributions imply that they also have unique features. The plot could be used to compare the performance or characteristics of two different models or algorithms, with "A-mem" potentially representing a model with memory or attention mechanisms and "Base" representing a baseline model.