\n
## Scatter Plot: A-mem vs. Base
### Overview
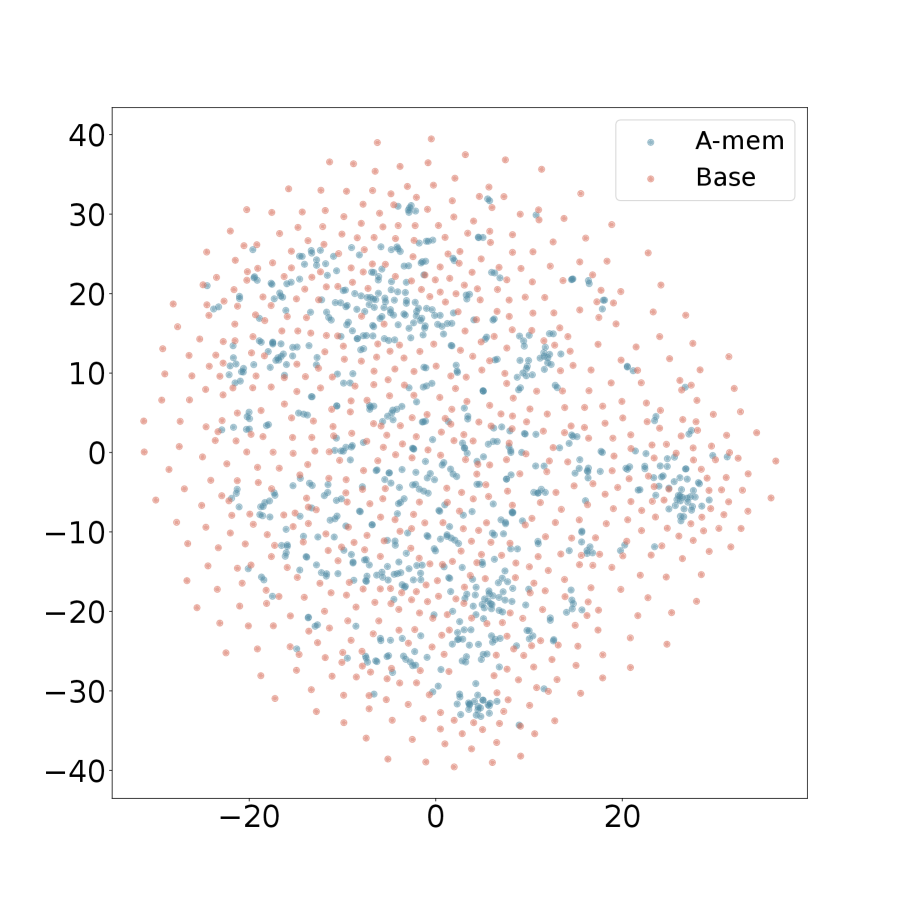
The image presents a scatter plot comparing two datasets, labeled "A-mem" and "Base". The plot displays the distribution of data points across a two-dimensional space, with both axes ranging from approximately -40 to 40. The data points are represented as small dots, with "A-mem" in blue and "Base" in orange/red.
### Components/Axes
* **X-axis:** Ranges from approximately -25 to 25. No explicit label is provided.
* **Y-axis:** Ranges from approximately -40 to 40. No explicit label is provided.
* **Legend:** Located in the top-right corner.
* "A-mem" - Represented by blue dots.
* "Base" - Represented by orange/red dots.
### Detailed Analysis
The plot shows a dense scattering of points for both datasets.
**A-mem (Blue Dots):**
The points are generally clustered around the y-axis, with a wider spread along the x-axis. The distribution appears roughly symmetrical around x=0.
* The highest y-value observed is approximately 35.
* The lowest y-value observed is approximately -35.
* The highest x-value observed is approximately 22.
* The lowest x-value observed is approximately -22.
* There is a slight concentration of points in the upper-left and upper-right quadrants.
**Base (Orange/Red Dots):**
The points are more evenly distributed across the entire plot area, with a similar spread along both axes.
* The highest y-value observed is approximately 38.
* The lowest y-value observed is approximately -40.
* The highest x-value observed is approximately 23.
* The lowest x-value observed is approximately -23.
* There appears to be a slightly higher density of points in the lower quadrants.
There is significant overlap between the two datasets, making it difficult to visually separate them completely.
### Key Observations
* Both datasets exhibit a roughly normal distribution, although this is difficult to confirm precisely without statistical analysis.
* The "Base" dataset has a slightly wider range of values along the y-axis compared to "A-mem".
* The distributions of both datasets are centered around x=0.
* The overlap between the two datasets suggests that they may share some underlying characteristics.
### Interpretation
The scatter plot likely represents a comparison of two different methods or conditions ("A-mem" and "Base") across two measured variables (represented by the x and y axes). The lack of axis labels makes it impossible to determine the specific meaning of these variables.
The overlapping distributions suggest that both methods/conditions produce similar results, but with some degree of variability. The slight differences in range and density may indicate that one method/condition is more prone to extreme values or has a different underlying distribution.
Without knowing the context of the data, it is difficult to draw definitive conclusions. However, the plot suggests that "A-mem" might be more concentrated around the y-axis, while "Base" is more spread out. Further analysis, including statistical tests, would be needed to determine whether these differences are statistically significant. The plot is a visual representation of the data, and does not provide any facts or data beyond the distribution of points.