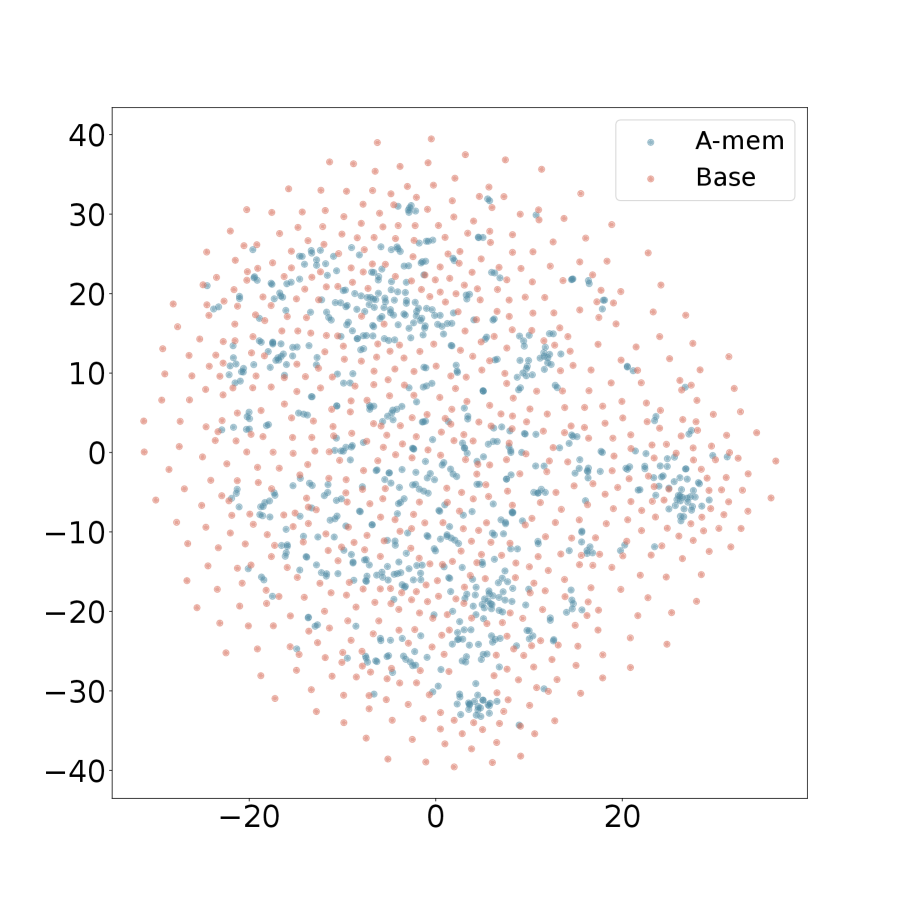
# Technical Document Extraction: Scatter Plot Analysis
## 1. **Axis Labels and Markers**
- **X-axis**: Ranges from -40 to 40, with tick marks at -40, -20, 0, 20, 40.
- **Y-axis**: Ranges from -40 to 40, with tick marks at -40, -20, 0, 20, 40.
- **No explicit axis titles** (e.g., "X" or "Y") are visible in the image.
## 2. **Legend**
- **Location**: Top-right corner of the plot.
- **Labels**:
- `A-mem` (blue data points).
- `Base` (red data points).
- **Color Verification**:
- Blue points correspond to `A-mem`.
- Red points correspond to `Base`.
## 3. **Data Series**
### A. `A-mem` (Blue)
- **Distribution**:
- Concentrated in the central region of the plot (approximately between -20 and 20 on both axes).
- Higher density near the origin (0,0).
- **Trend**:
- Points exhibit a clustered pattern, suggesting a central tendency or grouping around the origin.
### B. `Base` (Red)
- **Distribution**:
- Spread across the entire plot, with a higher concentration near the edges (e.g., near x = ±40, y = ±40).
- Fewer points near the origin compared to `A-mem`.
- **Trend**:
- Points form a more dispersed, radial pattern, indicating a broader or more uniform distribution.
## 4. **Visual Trends**
- **Contrast**:
- `A-mem` (blue) dominates the central region, while `Base` (red) dominates the periphery.
- Overlap occurs in the mid-range regions (e.g., between -20 and 20 on both axes).
- **Density**:
- `A-mem` has a higher density of points in the central cluster.
- `Base` has a more even distribution across the plot.
## 5. **Spatial Grounding**
- **Legend Position**: Top-right corner (coordinates: x ≈ 35, y ≈ 35).
- **Data Point Alignment**:
- Blue (`A-mem`) points align with the legend’s blue marker.
- Red (`Base`) points align with the legend’s red marker.
## 6. **Additional Observations**
- **Plot Shape**: Square grid with equal scaling on both axes.
- **No Text Blocks or Tables**: The image contains no embedded text, tables, or non-English content.
## 7. **Conclusion**
The scatter plot compares two datasets (`A-mem` and `Base`) spatially. `A-mem` exhibits a central clustering pattern, while `Base` shows a more dispersed distribution. No numerical data or explicit categories beyond the two series are present.