# Technical Document Extraction: Control Effect Analysis
## Image Overview
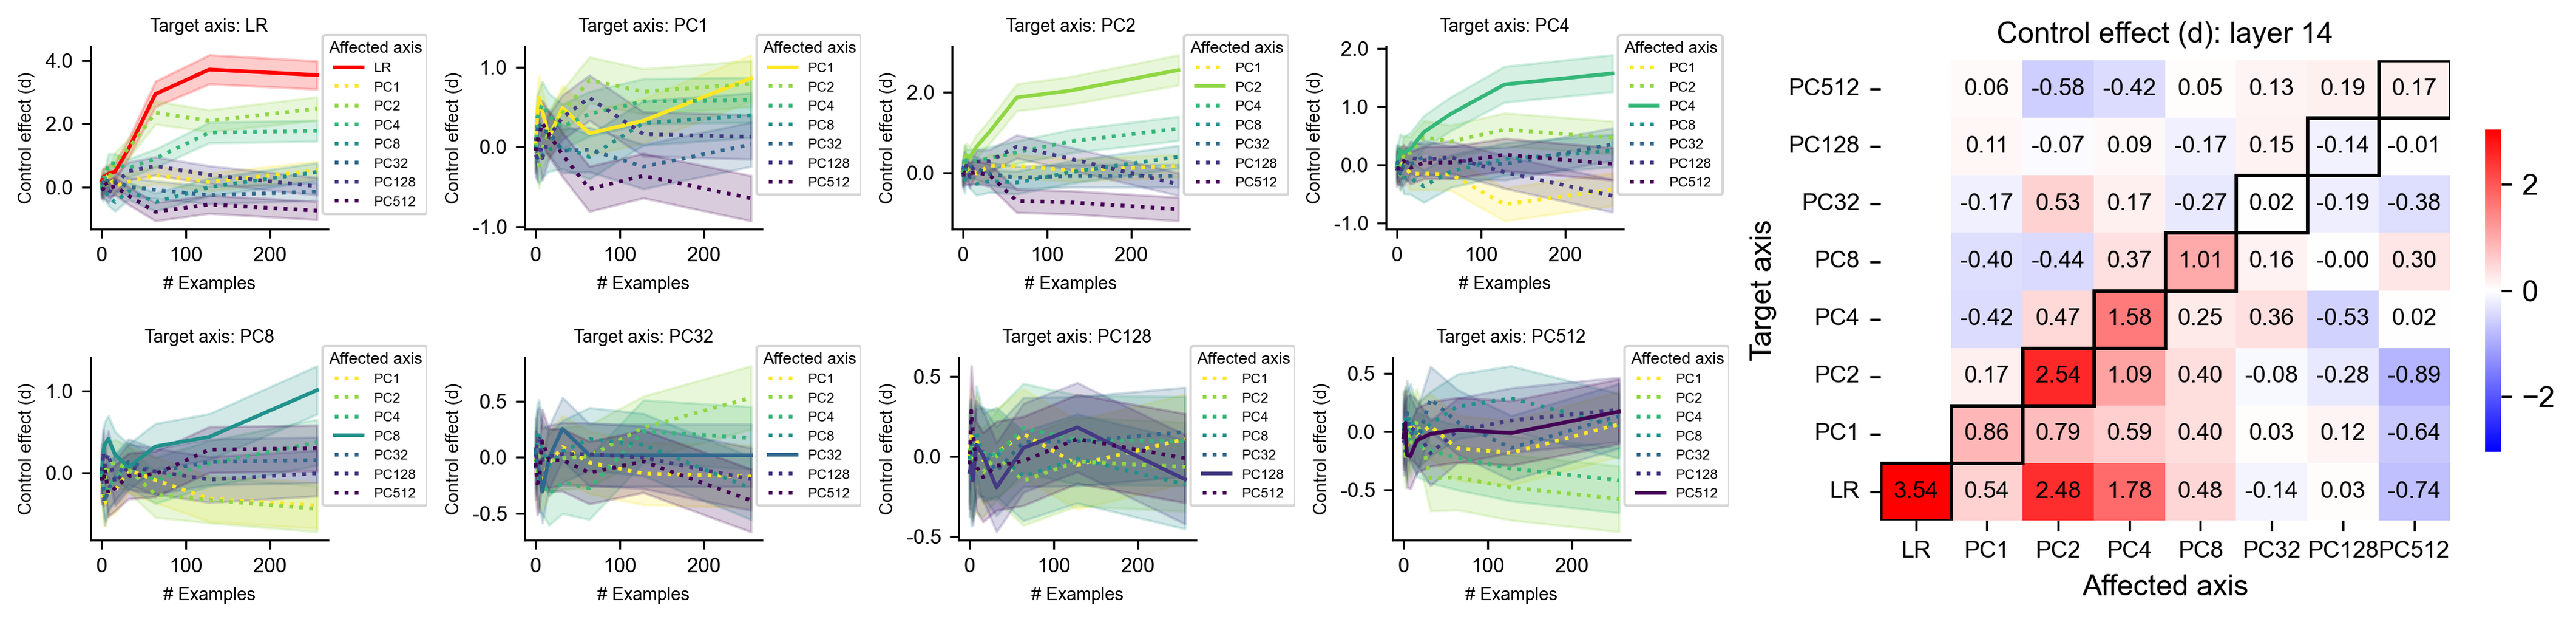
The image contains **eight line graphs** and **one heatmap**, analyzing control effects across different principal component (PC) axes. The graphs and heatmap are organized to show relationships between target axes and affected axes, with numerical values and visual trends.
---
## Line Graphs (Left Section)
### General Structure
- **X-axis**: `# Examples` (0–200)
- **Y-axis**: `Control effect (d)`
- **Legend**: Located in the **upper right corner** of each graph, listing affected axes with color/style mappings.
- **Key Observations**:
- Each graph has a **target axis** (e.g., LR, PC1, PC2) and an **affected axis** (e.g., PC1, PC2, PC4).
- Lines represent affected axes, with shaded regions indicating confidence intervals.
### Graph-Specific Details
1. **Target Axis: LR**
- **Affected Axes**: PC1 (orange dashed), PC2 (green dotted), PC4 (blue dash-dot), PC8 (teal solid), PC32 (purple dash-dot), PC128 (dark blue dotted), PC512 (black dashed).
- **Trend**: PC1 (orange) shows a sharp upward trend; PC2 (green) and PC4 (blue) plateau near zero. PC8 (teal) and PC32 (purple) exhibit moderate increases.
2. **Target Axis: PC1**
- **Affected Axes**: Same as above.
- **Trend**: PC1 (orange) increases steadily; PC2 (green) and PC4 (blue) show minor fluctuations. PC8 (teal) and PC32 (purple) remain near zero.
3. **Target Axis: PC2**
- **Affected Axes**: Same as above.
- **Trend**: PC2 (green) increases sharply; PC4 (blue) and PC8 (teal) show moderate growth. PC32 (purple) and PC128 (dark blue) plateau.
4. **Target Axis: PC4**
- **Affected Axes**: Same as above.
- **Trend**: PC4 (blue) increases steadily; PC8 (teal) and PC32 (purple) show minor fluctuations. PC128 (dark blue) and PC512 (black) remain near zero.
5. **Target Axis: PC8**
- **Affected Axes**: Same as above.
- **Trend**: PC8 (teal) increases sharply; PC32 (purple) and PC128 (dark blue) show moderate growth. PC512 (black) remains near zero.
6. **Target Axis: PC32**
- **Affected Axes**: Same as above.
- **Trend**: PC32 (purple) increases steadily; PC128 (dark blue) and PC512 (black) show minor fluctuations. PC1 (orange) and PC2 (green) remain near zero.
7. **Target Axis: PC128**
- **Affected Axes**: Same as above.
- **Trend**: PC128 (dark blue) increases sharply; PC512 (black) shows moderate growth. PC1 (orange) and PC2 (green) remain near zero.
8. **Target Axis: PC512**
- **Affected Axes**: Same as above.
- **Trend**: PC512 (black) increases steadily; PC1 (orange) and PC2 (green) show minor fluctuations. PC4 (blue) and PC8 (teal) remain near zero.
---
## Heatmap (Right Section)
### Structure
- **Title**: `Control effect (d): layer 14`
- **Rows**: Target axes (`PC512`, `PC32`, `PC8`, `PC4`, `PC2`, `PC1`, `LR`)
- **Columns**: Affected axes (`PC1`, `PC2`, `PC4`, `PC8`, `PC32`, `PC128`, `PC512`)
- **Color Scale**:
- **Red**: Positive values (up to 2)
- **Blue**: Negative values (down to -2)
- **White**: Near-zero values
### Data Table
| Target Axis | PC1 | PC2 | PC4 | PC8 | PC32 | PC128 | PC512 |
|-------------|-------|-------|-------|-------|-------|-------|-------|
| PC512 | 0.06 | -0.58 | -0.42 | 0.05 | 0.13 | 0.19 | 0.17 |
| PC32 | 0.11 | -0.07 | 0.09 | -0.17 | 0.15 | -0.14 | -0.01 |
| PC8 | -0.17 | 0.53 | 0.17 | -0.27 | 0.02 | -0.19 | -0.38 |
| PC4 | -0.40 | -0.44 | 0.37 | 1.01 | 0.16 | -0.00 | 0.30 |
| PC2 | -0.42 | 0.77 | 1.58 | 0.25 | 0.36 | -0.53 | 0.02 |
| PC1 | 0.17 | 2.54 | 1.09 | 0.40 | -0.08 | -0.28 | -0.89 |
| LR | 3.54 | 2.48 | 1.78 | 0.48 | -0.14 | 0.03 | -0.74 |
---
## Key Trends and Data Points
1. **Line Graphs**:
- **PC1 (orange dashed)** consistently shows the highest control effect across most target axes.
- **LR (red solid)** exhibits the most pronounced increase in control effect, especially in the LR-target graph.
- **PC512 (black dashed)** often remains near zero or shows minimal variation.
2. **Heatmap**:
- **Highest Control Effect**: LR (target) affecting PC1 (value: **3.54**).
- **Strongest Negative Effect**: PC1 (target) affecting PC512 (value: **-0.89**).
- **Moderate Effects**: PC2 (target) affecting PC4 (value: **1.58**) and PC1 (target) affecting PC2 (value: **2.54**).
---
## Spatial Grounding and Legend Verification
- **Legend Position**: Upper right corner of each line graph.
- **Color Matching**:
- PC1: Orange dashed (confirmed in all graphs).
- PC2: Green dotted (confirmed).
- PC4: Blue dash-dot (confirmed).
- PC8: Teal solid (confirmed).
- PC32: Purple dash-dot (confirmed).
- PC128: Dark blue dotted (confirmed).
- PC512: Black dashed (confirmed).
---
## Language and Transcription
- **Primary Language**: English.
- **No Additional Languages Detected**.
---
## Conclusion
The image provides a comprehensive analysis of control effects across principal component axes, with line graphs illustrating trends and a heatmap quantifying numerical values. The LR axis demonstrates the most significant control effects, particularly when targeting PC1.