\n
## Diagram: Procedure for Background Detection and Image Recovery
### Overview
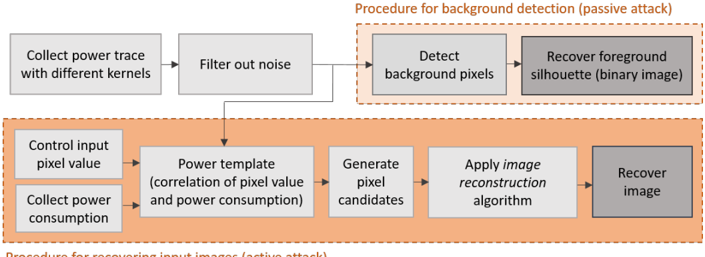
The image presents a flowchart-style diagram illustrating two procedures: one for background detection (a passive attack) and another for recovering input images (an active attack). The diagram details the steps involved in each procedure, showing the flow of information and processing.
### Components/Axes
The diagram is divided into two main sections, visually separated by color:
* **Top Section (Light Blue):** Procedure for background detection (passive attack).
* **Bottom Section (Orange):** Procedure for recovering input images (active attack).
Each section consists of rectangular blocks representing processing steps, connected by arrows indicating the flow of data.
### Detailed Analysis or Content Details
**Top Section (Passive Attack - Background Detection):**
1. **Collect power trace with different kernels:** This is the initial step.
2. **Filter out noise:** The output of the first step is fed into this step.
3. **Detect background pixels:** The filtered data is then used to detect background pixels.
4. **Recover foreground silhouette (binary image):** The detected background pixels are used to recover the foreground silhouette, resulting in a binary image.
**Bottom Section (Active Attack - Image Recovery):**
1. **Control input pixel value:** This is the starting point for the active attack.
2. **Collect power consumption:** Power consumption is collected based on the controlled input pixel value.
3. **Power template (correlation of pixel value and power consumption):** A power template is created by correlating the pixel value and power consumption.
4. **Generate pixel candidates:** Pixel candidates are generated using the power template.
5. **Apply image reconstruction algorithm:** An image reconstruction algorithm is applied to the pixel candidates.
6. **Recover image:** The final step results in the recovery of the image.
**Footer Text:**
"Procedure for recovering input images (active attack)"
### Key Observations
The diagram clearly distinguishes between a passive and an active attack method. The passive attack focuses on detecting background pixels from existing power traces, while the active attack involves controlling input pixel values and analyzing power consumption to reconstruct the image. The diagram highlights the sequential nature of each procedure, with each step building upon the previous one.
### Interpretation
This diagram illustrates a security vulnerability and potential attack vectors related to side-channel analysis, specifically power analysis. The passive attack demonstrates how background information can be extracted without directly interacting with the system, while the active attack shows how controlled inputs can be used to reconstruct sensitive data (the image). The correlation between pixel values and power consumption is a key element in the active attack, suggesting that variations in power usage can reveal information about the input data. The diagram suggests a potential method for extracting information from a system by analyzing its power consumption patterns. The use of "kernels" in the power trace collection suggests signal processing techniques are employed to enhance the signal and reduce noise. The binary image output from the passive attack suggests a segmentation process is used to isolate the foreground from the background. The diagram is a high-level overview and doesn't provide details on the specific algorithms or techniques used in each step.