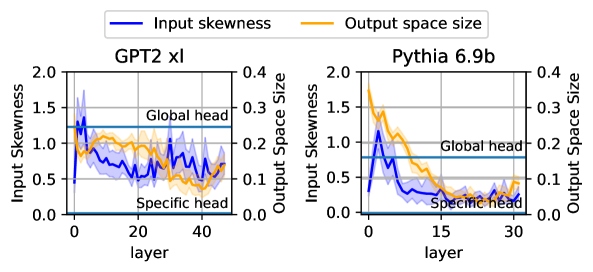
## Chart: Input Skewness and Output Space Size vs. Layer
### Overview
The image presents two line charts comparing "Input Skewness" and "Output Space Size" across layers for two different models: GPT2 xl and Pythia 6.9b. Each chart displays the variation of these two metrics as the layer number increases. The charts also include horizontal lines indicating "Global head" and "Specific head" levels.
### Components/Axes
**General Layout:**
* Two charts are positioned side-by-side. The left chart represents "GPT2 xl," and the right chart represents "Pythia 6.9b."
* Each chart has two y-axes: the left y-axis represents "Input Skewness," and the right y-axis represents "Output Space Size."
* The x-axis represents "layer" for both charts.
* A legend is located at the top of the image, indicating that the blue line represents "Input skewness" and the orange line represents "Output space size."
**Left Chart (GPT2 xl):**
* **Title:** GPT2 xl
* **X-axis:** "layer" ranging from 0 to 40 in increments of 20.
* **Left Y-axis:** "Input Skewness" ranging from 0.0 to 2.0 in increments of 0.5.
* **Right Y-axis:** "Output Space Size" ranging from 0.0 to 0.4 in increments of 0.1.
* **Horizontal Lines:**
* "Global head" at approximately 1.25 on the Input Skewness axis (approximately 0.25 on the Output Space Size axis).
* "Specific head" at 0.0 on the Input Skewness axis (0.0 on the Output Space Size axis).
**Right Chart (Pythia 6.9b):**
* **Title:** Pythia 6.9b
* **X-axis:** "layer" ranging from 0 to 30 in increments of 15.
* **Left Y-axis:** "Input Skewness" ranging from 0.0 to 2.0 in increments of 0.5.
* **Right Y-axis:** "Output Space Size" ranging from 0.0 to 0.4 in increments of 0.1.
* **Horizontal Lines:**
* "Global head" at approximately 0.8 on the Input Skewness axis (approximately 0.16 on the Output Space Size axis).
* "Specific head" at 0.0 on the Input Skewness axis (0.0 on the Output Space Size axis).
**Legend:**
* Located at the top of the image.
* Blue line: "Input skewness"
* Orange line: "Output space size"
### Detailed Analysis
**Left Chart (GPT2 xl):**
* **Input skewness (blue line):** Starts high (around 1.4), drops sharply to approximately 0.6 around layer 5, fluctuates between 0.5 and 1.0, and ends around 0.6 at layer 40.
* **Output space size (orange line):** Starts around 1.0, fluctuates between 0.4 and 1.1, and ends around 0.5 at layer 40.
**Right Chart (Pythia 6.9b):**
* **Input skewness (blue line):** Starts high (around 1.2), drops sharply to approximately 0.2 around layer 10, fluctuates slightly, and ends around 0.2 at layer 30.
* **Output space size (orange line):** Starts high (around 1.7), drops sharply to approximately 0.1 around layer 15, fluctuates slightly, and ends around 0.1 at layer 30.
### Key Observations
* Both models show a decrease in "Input skewness" and "Output space size" as the layer number increases.
* The "Input skewness" drops more sharply in Pythia 6.9b compared to GPT2 xl.
* The "Output space size" also decreases more sharply in Pythia 6.9b compared to GPT2 xl.
* The "Global head" level is higher for GPT2 xl compared to Pythia 6.9b.
### Interpretation
The charts illustrate how "Input Skewness" and "Output Space Size" change across different layers in the GPT2 xl and Pythia 6.9b models. The decreasing trends suggest that as the models process information through deeper layers, both the skewness of the input and the size of the output space tend to diminish. The difference in the "Global head" levels and the rate of decrease between the two models may indicate variations in their architectural design or training methodologies. The "Specific head" level at 0.0 likely represents a baseline or a point of reference for comparison. The shaded regions around the lines likely represent variance or uncertainty in the measurements.