\n
## Chart: Input Skewness and Output Space Size vs. Layer
### Overview
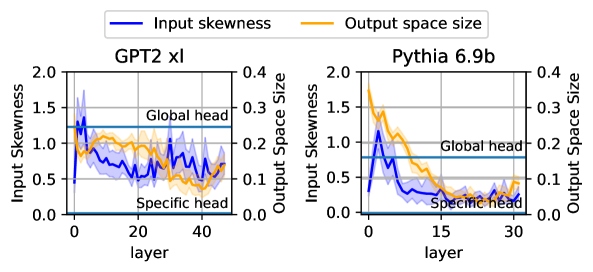
The image presents two line charts comparing "Input Skewness" and "Output Space Size" across layers for two different models: "GPT2 xl" and "Pythia 6.9b". Both charts share the same axes and legend, allowing for a direct comparison of the two models. The charts are positioned side-by-side.
### Components/Axes
* **X-axis:** "layer" - ranging from approximately 0 to 45 for GPT2 xl and 0 to 35 for Pythia 6.9b.
* **Left Y-axis:** "Input Skewness" - ranging from 0.0 to 2.0.
* **Right Y-axis:** "Output Space Size" - ranging from 0.0 to 0.4.
* **Legend:**
* Blue Line: "Input skewness"
* Orange Line: "Output space size"
* **Titles:**
* Left Chart: "GPT2 xl"
* Right Chart: "Pythia 6.9b"
* **Annotations:**
* Horizontal lines at y = 1.25 for Input Skewness labeled "Global head"
* Horizontal lines at y = 0.08 for Output Space Size labeled "Specific head"
### Detailed Analysis or Content Details
**GPT2 xl Chart:**
* **Input Skewness (Blue Line):** Starts at approximately 1.3, decreases rapidly to around 0.7 by layer 10, then fluctuates between 0.6 and 0.9 with several oscillations until layer 45, ending around 0.7.
* **Output Space Size (Orange Line):** Starts at approximately 0.28, decreases steadily to around 0.1 by layer 10, then fluctuates between 0.08 and 0.15 until layer 45, ending around 0.1.
**Pythia 6.9b Chart:**
* **Input Skewness (Blue Line):** Starts at approximately 1.4, decreases rapidly to around 0.7 by layer 5, then fluctuates between 0.5 and 0.8 with several oscillations until layer 35, ending around 0.6.
* **Output Space Size (Orange Line):** Starts at approximately 0.3, decreases steadily to around 0.1 by layer 10, then fluctuates between 0.07 and 0.13 until layer 35, ending around 0.1.
### Key Observations
* Both models exhibit a similar trend: both "Input Skewness" and "Output Space Size" decrease initially and then stabilize with fluctuations as the layer number increases.
* The "Input Skewness" consistently remains above the "Specific head" annotation line (y=0.08) for both models.
* The "Output Space Size" fluctuates around the "Specific head" annotation line (y=0.08) for both models.
* The initial decrease in both metrics is more pronounced in the GPT2 xl model compared to the Pythia 6.9b model.
* The fluctuations in both metrics appear to be more frequent and larger in magnitude for the GPT2 xl model.
### Interpretation
The charts suggest that as information propagates through the layers of both GPT2 xl and Pythia 6.9b, the input distribution becomes less skewed (Input Skewness decreases), and the dimensionality of the output space stabilizes (Output Space Size decreases and fluctuates). The initial rapid decrease likely represents the initial processing and feature extraction stages. The subsequent fluctuations indicate a dynamic interplay between different layers and features.
The differences between the two models suggest that GPT2 xl might have a more complex internal representation, as evidenced by the more pronounced fluctuations in both metrics. The "Global head" and "Specific head" annotations suggest that these values represent some kind of threshold or target for the models' internal states. The fact that Input Skewness remains above the "Specific head" line suggests that the input distribution is always somewhat non-normal, while the Output Space Size fluctuates around it, indicating a more dynamic relationship.
The charts provide insights into the internal dynamics of these large language models, potentially aiding in understanding their behavior and improving their performance. Further investigation could explore the correlation between these metrics and the models' performance on specific tasks.