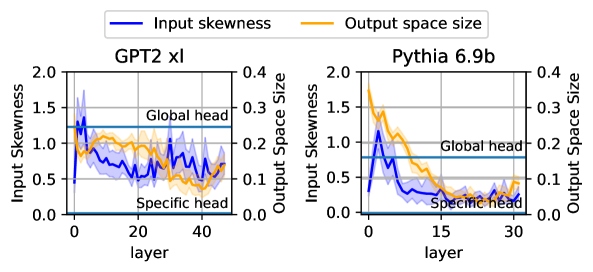
## Line Graphs: Input Skewness and Output Space Size Across Layers for GPT-2 XL and Pythia 6.9b
### Overview
The image contains two side-by-side line graphs comparing the **input skewness** (blue) and **output space size** (orange) across layers for two language models: **GPT-2 XL** (left) and **Pythia 6.9b** (right). Each graph includes annotations for "Global head" (horizontal blue line) and "Specific head" (horizontal orange line), with shaded regions indicating variability.
---
### Components/Axes
1. **X-Axis (Layers)**:
- **GPT-2 XL**: Labeled "layer," ranging from 0 to 40.
- **Pythia 6.9b**: Labeled "layer," ranging from 0 to 30.
2. **Y-Axes**:
- **Left Y-Axis (Input Skewness)**: Ranges from 0.0 to 2.0 for both graphs.
- **Right Y-Axis (Output Space Size)**: Ranges from 0.0 to 0.4 for both graphs.
3. **Legends**:
- **Blue**: Input skewness.
- **Orange**: Output space size.
4. **Annotations**:
- "Global head" (horizontal blue line at ~0.5 input skewness).
- "Specific head" (horizontal orange line at ~0.1 output space size).
---
### Detailed Analysis
#### GPT-2 XL (Left Graph)
- **Input Skewness (Blue)**:
- Starts at ~1.5 (layer 0), drops sharply to ~0.5 by layer 10, then fluctuates between ~0.5 and ~1.0 up to layer 40.
- Notable peaks at layers 5 (~1.2) and 30 (~1.1).
- **Output Space Size (Orange)**:
- Begins at ~0.1 (layer 0), rises to ~0.3 by layer 10, then declines to ~0.1 by layer 40.
- Peaks at layer 15 (~0.35).
#### Pythia 6.9b (Right Graph)
- **Input Skewness (Blue)**:
- Starts at ~1.5 (layer 0), drops sharply to ~0.2 by layer 5, then stabilizes between ~0.1 and ~0.3 up to layer 30.
- Sharp decline in early layers (layers 0–5).
- **Output Space Size (Orange)**:
- Begins at ~0.3 (layer 0), drops to ~0.1 by layer 5, then fluctuates between ~0.1 and ~0.2 up to layer 30.
- Sharp decline in early layers (layers 0–5).
---
### Key Observations
1. **Early Layer Dominance**:
- Both models show **high input skewness** and **output space size** in early layers (layers 0–10), suggesting these layers handle more variable or complex information.
2. **Convergence**:
- By later layers (layers 20–30/40), input skewness and output space size stabilize near the "Global head" and "Specific head" thresholds, indicating reduced variability.
3. **Model Differences**:
- **GPT-2 XL** retains higher input skewness in later layers compared to **Pythia 6.9b**, which stabilizes earlier.
- **Pythia 6.9b** has a more pronounced drop in output space size in early layers.
---
### Interpretation
- **Input Skewness Trends**:
- High skewness in early layers may reflect the models' reliance on diverse or noisy data for initial processing. The sharper decline in Pythia 6.9b suggests more efficient normalization or regularization in these layers.
- **Output Space Size**:
- Early-layer peaks imply these layers generate highly variable representations, which consolidate into more stable patterns in later layers. The "Specific head" threshold (~0.1) acts as a baseline for model-specific processing.
- **Global vs. Specific Heads**:
- The "Global head" line (~0.5 input skewness) and "Specific head" line (~0.1 output space size) likely represent architectural benchmarks. Layers crossing these thresholds may transition from general to task-specific processing.
- **Anomalies**:
- GPT-2 XL's input skewness spike at layer 30 (~1.1) and Pythia 6.9b's output space size fluctuation at layer 25 (~0.2) suggest potential architectural or training quirks in these layers.
---
### Conclusion
The graphs highlight how early layers in both models exhibit higher variability in input and output metrics, which diminish as layers progress. This aligns with the hypothesis that early layers handle general feature extraction, while later layers specialize in task-specific processing. The "Global head" and "Specific head" annotations provide critical reference points for understanding layer-specific behavior.