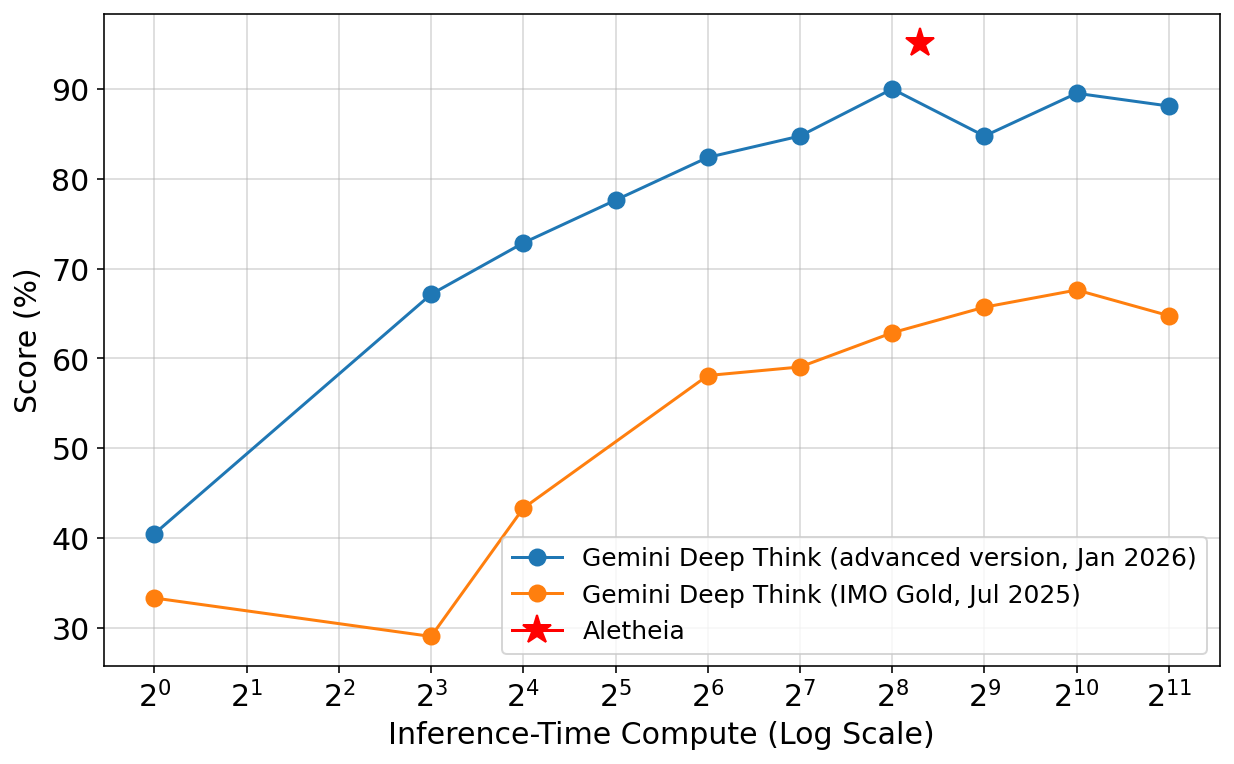
## Line Chart: Score vs. Inference-Time Compute
### Overview
The image is a line chart comparing the performance of two versions of "Gemini Deep Think" (advanced version, Jan 2026 and IMO Gold, Jul 2025) and "Aletheia" based on their score (%) against Inference-Time Compute (Log Scale). The x-axis represents Inference-Time Compute on a log scale, while the y-axis represents the score in percentage.
### Components/Axes
* **Title:** There is no explicit title on the chart.
* **X-Axis:** Inference-Time Compute (Log Scale). The x-axis is marked with powers of 2, from 2<sup>0</sup> to 2<sup>11</sup>.
* **Y-Axis:** Score (%). The y-axis ranges from 30% to 90% with gridlines at intervals of 10%.
* **Legend:** Located in the bottom-right of the chart.
* Blue line: Gemini Deep Think (advanced version, Jan 2026)
* Orange line: Gemini Deep Think (IMO Gold, Jul 2025)
* Red star: Aletheia
### Detailed Analysis
* **Gemini Deep Think (advanced version, Jan 2026) - Blue Line:**
* Trend: Generally increasing with some fluctuation.
* Data Points:
* 2<sup>0</sup>: Approximately 40%
* 2<sup>3</sup>: Approximately 67%
* 2<sup>4</sup>: Approximately 73%
* 2<sup>5</sup>: Approximately 78%
* 2<sup>6</sup>: Approximately 83%
* 2<sup>7</sup>: Approximately 85%
* 2<sup>8</sup>: Approximately 90%
* 2<sup>9</sup>: Approximately 85%
* 2<sup>10</sup>: Approximately 90%
* 2<sup>11</sup>: Approximately 88%
* **Gemini Deep Think (IMO Gold, Jul 2025) - Orange Line:**
* Trend: Initially decreasing, then increasing, and finally plateauing.
* Data Points:
* 2<sup>0</sup>: Approximately 33%
* 2<sup>3</sup>: Approximately 29%
* 2<sup>4</sup>: Approximately 43%
* 2<sup>5</sup>: Approximately 53%
* 2<sup>6</sup>: Approximately 58%
* 2<sup>7</sup>: Approximately 59%
* 2<sup>8</sup>: Approximately 63%
* 2<sup>9</sup>: Approximately 66%
* 2<sup>10</sup>: Approximately 68%
* 2<sup>11</sup>: Approximately 65%
* **Aletheia - Red Star:**
* Single data point at Inference-Time Compute 2<sup>8</sup> with a score of approximately 95%.
### Key Observations
* The advanced version of Gemini Deep Think consistently outperforms the IMO Gold version across all inference-time compute values.
* The performance of the advanced version peaks around 2<sup>8</sup> and 2<sup>10</sup>, with a slight dip at 2<sup>9</sup>.
* The IMO Gold version shows a significant increase in performance between 2<sup>3</sup> and 2<sup>10</sup>, but plateaus afterward.
* Aletheia has a single data point, showing a high score at 2<sup>8</sup>.
### Interpretation
The chart illustrates the relationship between inference-time compute and the performance of different AI models. The advanced version of Gemini Deep Think demonstrates superior performance compared to the IMO Gold version, suggesting improvements in the model architecture or training data. The single data point for Aletheia indicates a high-performance level at a specific compute value, but lacks information about its performance at other compute levels. The logarithmic scale on the x-axis suggests that the performance gains diminish as the compute increases, particularly for the IMO Gold version. The data suggests that there is a point of diminishing returns for increasing inference-time compute, especially for the IMO Gold version of Gemini Deep Think.