## Line Chart: Performance Score vs. Compute
### Overview
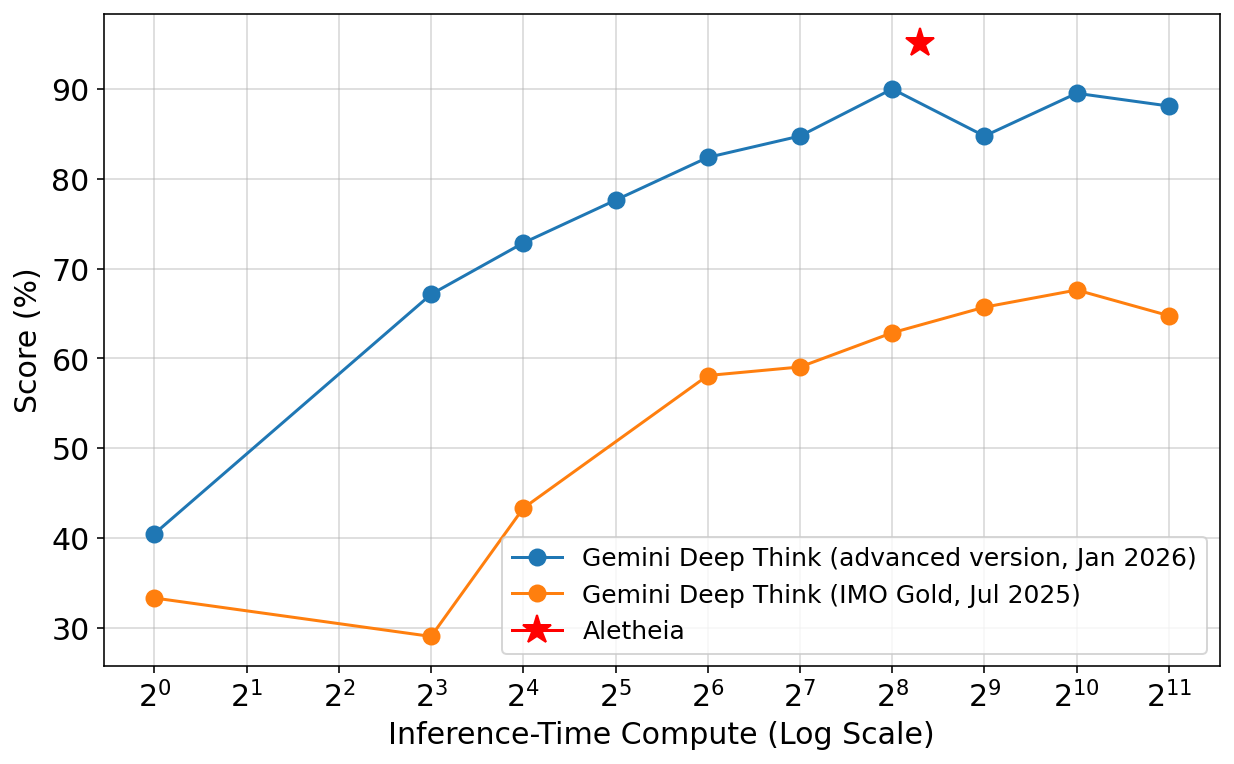
This line chart compares the performance scores of three AI models – Gemini Deep Think (advanced version, Jan 2026), Gemini Deep Think (IMO Gold, Jul 2025), and Aletheia – against the Inference-Time Compute, measured on a logarithmic scale. The chart illustrates how performance changes as computational resources increase.
### Components/Axes
* **X-axis:** Inference-Time Compute (Log Scale). Marked with values from 2<sup>0</sup> to 2<sup>11</sup>.
* **Y-axis:** Score (%). Ranges from approximately 30% to 95%.
* **Data Series:**
* Gemini Deep Think (advanced version, Jan 2026) – Represented by a blue line with circular markers.
* Gemini Deep Think (IMO Gold, Jul 2025) – Represented by an orange line with circular markers.
* Aletheia – Represented by a red star marker.
* **Legend:** Located in the bottom-right corner, clearly labeling each data series with its name and date.
### Detailed Analysis
**Gemini Deep Think (advanced version, Jan 2026) – Blue Line:**
The blue line shows an overall upward trend, indicating increasing performance with increasing compute.
* At 2<sup>0</sup> (approximately 1), the score is approximately 40%.
* At 2<sup>2</sup> (approximately 4), the score is approximately 60%.
* At 2<sup>3</sup> (approximately 8), the score is approximately 65%.
* At 2<sup>4</sup> (approximately 16), the score is approximately 73%.
* At 2<sup>5</sup> (approximately 32), the score is approximately 75%.
* At 2<sup>6</sup> (approximately 64), the score is approximately 82%.
* At 2<sup>7</sup> (approximately 128), the score is approximately 85%.
* At 2<sup>8</sup> (approximately 256), the score is approximately 92%.
* At 2<sup>9</sup> (approximately 512), the score is approximately 86%.
* At 2<sup>10</sup> (approximately 1024), the score is approximately 88%.
* At 2<sup>11</sup> (approximately 2048), the score is approximately 90%.
**Gemini Deep Think (IMO Gold, Jul 2025) – Orange Line:**
The orange line initially decreases, then increases, but remains below the advanced version.
* At 2<sup>0</sup> (approximately 1), the score is approximately 32%.
* At 2<sup>2</sup> (approximately 4), the score is approximately 30%.
* At 2<sup>3</sup> (approximately 8), the score is approximately 43%.
* At 2<sup>4</sup> (approximately 16), the score is approximately 45%.
* At 2<sup>5</sup> (approximately 32), the score is approximately 58%.
* At 2<sup>6</sup> (approximately 64), the score is approximately 60%.
* At 2<sup>7</sup> (approximately 128), the score is approximately 63%.
* At 2<sup>8</sup> (approximately 256), the score is approximately 65%.
* At 2<sup>9</sup> (approximately 512), the score is approximately 65%.
* At 2<sup>10</sup> (approximately 1024), the score is approximately 67%.
* At 2<sup>11</sup> (approximately 2048), the score is approximately 65%.
**Aletheia – Red Star:**
Aletheia is represented by a single data point.
* At 2<sup>8</sup> (approximately 256), the score is approximately 92%.
### Key Observations
* The advanced version of Gemini Deep Think consistently outperforms the IMO Gold version across all compute levels.
* Aletheia achieves a performance score comparable to the advanced Gemini Deep Think at a specific compute level (2<sup>8</sup>).
* The advanced Gemini Deep Think exhibits diminishing returns in performance gains as compute increases beyond 2<sup>7</sup>.
* The IMO Gold version shows a significant performance increase as compute increases from 2<sup>3</sup> to 2<sup>5</sup>.
### Interpretation
The chart demonstrates the relationship between computational resources and AI model performance. The advanced Gemini Deep Think model shows a strong positive correlation between compute and score, but with diminishing returns at higher compute levels. This suggests that there's a point where increasing compute yields less significant performance improvements. The IMO Gold version, while starting with a lower score, shows substantial gains with increased compute, indicating its potential for improvement with more resources. Aletheia's single data point suggests it can achieve comparable performance to the advanced Gemini Deep Think at a specific compute level, potentially indicating a more efficient architecture or algorithm. The data suggests that model architecture and algorithmic efficiency play a crucial role in performance, alongside raw computational power. The difference between the two Gemini models highlights the impact of advancements in model design and training.