## LineGraph: Performance Comparison of Gemini Deep Think Versions and Aletheia
### Overview
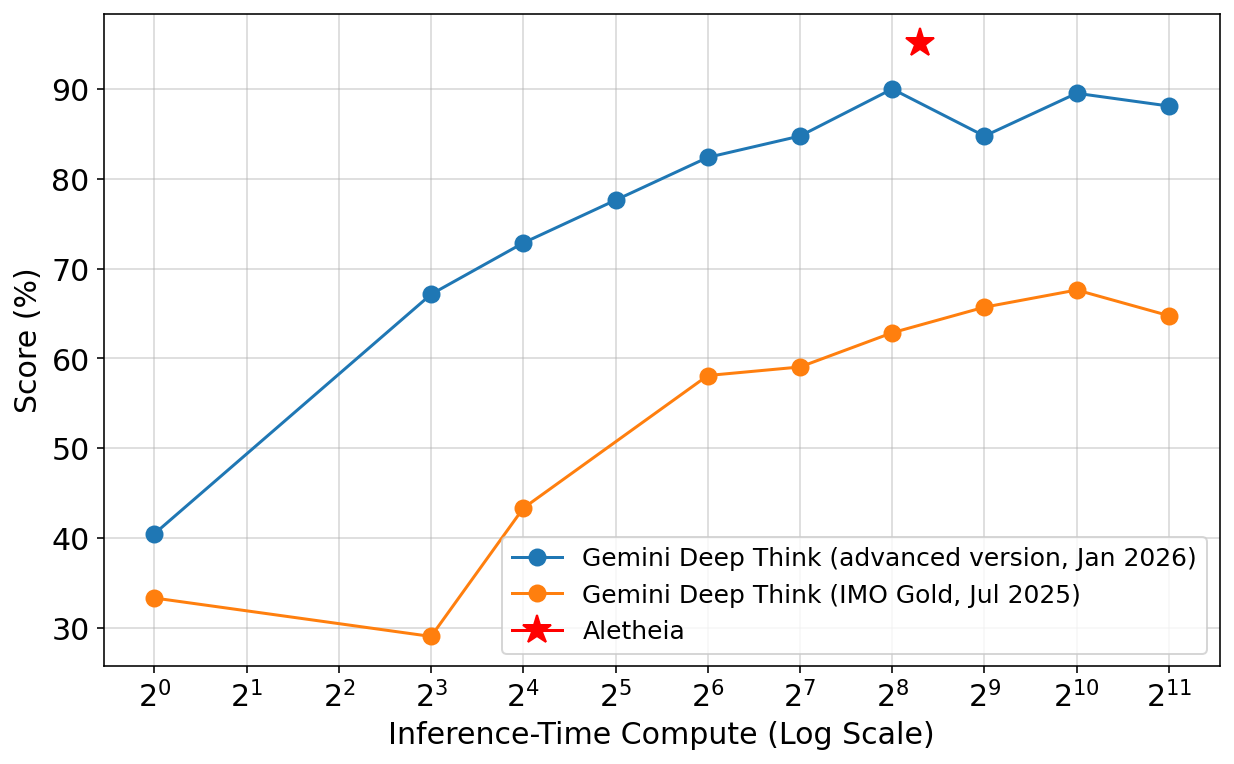
The image is a line graph comparing the performance scores of two versions of "Gemini Deep Think" and a benchmark labeled "Aletheia" across varying inference-time compute levels (log scale). The y-axis represents performance scores (%), while the x-axis represents inference-time compute in logarithmic increments (2⁰ to 2¹¹). A red star marks a specific data point labeled "Aletheia."
---
### Components/Axes
- **X-Axis (Horizontal)**:
- Label: "Inference-Time Compute (Log Scale)"
- Values: 2⁰, 2¹, 2², ..., 2¹¹ (logarithmic scale).
- Position: Bottom of the graph.
- **Y-Axis (Vertical)**:
- Label: "Score (%)"
- Range: 0% to 90% (linear scale).
- Position: Left side of the graph.
- **Legend**:
- Located in the bottom-right corner.
- Colors and labels:
- **Blue line**: "Gemini Deep Think (advanced version, Jan 2026)"
- **Orange line**: "Gemini Deep Think (IMO Gold, Jul 2025)"
- **Red star**: "Aletheia"
---
### Detailed Analysis
#### Blue Line (Gemini Deep Think - Advanced Version, Jan 2026):
- **Trend**: Starts at 40% at 2⁰, rises sharply to 90% at 2⁸, then plateaus with minor fluctuations.
- **Key Data Points**:
- 2⁰: 40%
- 2³: 67%
- 2⁴: 73%
- 2⁵: 78%
- 2⁶: 82%
- 2⁷: 85%
- 2⁸: 90%
- 2⁹: 85%
- 2¹⁰: 90%
- 2¹¹: 88%
#### Orange Line (Gemini Deep Think - IMO Gold, Jul 2025):
- **Trend**: Starts at 33% at 2⁰, drops to 29% at 2³, then rises steadily to 68% at 2¹⁰, followed by a slight decline.
- **Key Data Points**:
- 2⁰: 33%
- 2³: 29%
- 2⁴: 43%
- 2⁵: 52%
- 2⁶: 58%
- 2⁷: 59%
- 2⁸: 63%
- 2⁹: 66%
- 2¹⁰: 68%
- 2¹¹: 65%
#### Red Star (Aletheia):
- **Position**: At 2⁸ on the x-axis and 90% on the y-axis.
- **Note**: Overlaps with the peak of the blue line at 2⁸.
---
### Key Observations
1. **Blue Line Dominance**: The advanced Gemini version (blue) consistently outperforms the IMO Gold version (orange) across all compute levels, with a significant gap at higher compute levels (e.g., 2⁸–2¹¹).
2. **Aletheia Outlier**: The red star ("Aletheia") aligns with the blue line’s peak at 2⁸, suggesting it may represent a benchmark or idealized performance.
3. **Orange Line Lag**: The IMO Gold version (orange) shows a delayed improvement, starting below the blue line and never surpassing it.
4. **Log Scale Impact**: The x-axis’s logarithmic scale emphasizes exponential growth in compute, making early improvements (e.g., 2⁰–2³) appear less impactful than later gains.
---
### Interpretation
- **Performance Scaling**: The advanced Gemini version demonstrates superior scalability, achieving near-maximal performance (90%) at 2⁸ compute, while the IMO Gold version lags significantly.
- **Aletheia’s Role**: The red star’s alignment with the blue line’s peak implies it may represent an aspirational or theoretical maximum, or a specific optimized configuration.
- **Version Comparison**: The advanced version (Jan 2026) outperforms the IMO Gold version (Jul 2025) by ~25% at 2⁸ compute, highlighting the importance of version updates.
- **Anomalies**: The orange line’s dip at 2³ (29%) suggests potential instability or inefficiency at mid-range compute levels.
This graph underscores the critical role of compute resources and version optimization in achieving high performance, with the advanced Gemini version setting a new benchmark.