## Diagram: Image Processing Pipeline
### Overview
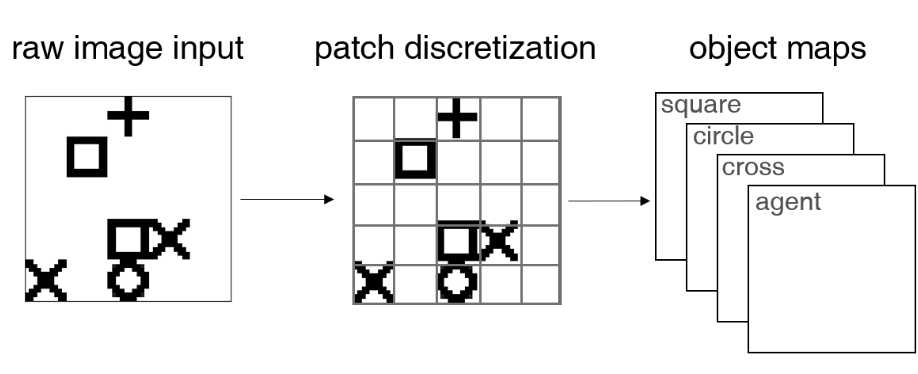
The diagram illustrates a three-stage process for analyzing visual data:
1. **Raw Image Input**: A scene containing geometric symbols (+, square, X, circle, agent)
2. **Patch Discretization**: Grid-based segmentation of the input image
3. **Object Maps**: Categorized representations of detected objects
### Components/Axes
- **Raw Image Input**
- Symbols:
- `+` (top-right)
- Square (top-left)
- X (bottom-left)
- Circle (bottom-right)
- Agent (center)
- **Patch Discretization**
- 3x3 grid structure
- Symbol distribution:
- Top-left: Square
- Top-middle: +
- Middle-left: X
- Middle-middle: Square + X (overlapping)
- Bottom-left: X
- Bottom-middle: Circle
- Bottom-right: X
- **Object Maps**
- Four labeled boxes (top to bottom):
1. Square
2. Circle
3. Cross (X)
4. Agent
### Detailed Analysis
1. **Symbol Distribution**
- The middle-middle grid cell contains two overlapping symbols (square and X), suggesting potential occlusion or complex spatial relationships.
- The agent symbol appears only in the raw image and final object map, not in the discretized grid, indicating it may be treated as a special case.
2. **Object Categorization**
- The "cross" category in object maps corresponds to the X symbol, while the "agent" box is uniquely labeled despite the agent symbol appearing in both raw image and final output.
- The square and circle symbols appear in both discretized grid and object maps, showing direct mapping.
3. **Spatial Relationships**
- The agent symbol's central position in the raw image correlates with its prominence in the final object map (largest box).
- The + symbol appears only in the top-middle grid cell and is absent from object maps, suggesting it may be filtered or classified as non-object.
### Key Observations
- **Anomaly**: The middle-middle grid cell contains two symbols, which may indicate a limitation in patch discretization or intentional overlap for analysis.
- **Agent Focus**: The agent's box in object maps is the largest, implying prioritization of the agent's perspective or role.
- **Symbol Filtering**: The + symbol disappears in object maps, suggesting it is either ignored or categorized differently.
### Interpretation
This pipeline demonstrates a computer vision workflow where:
1. Raw visual data is segmented into discrete patches for localized analysis.
2. Objects are identified and categorized, with the agent treated as a distinct entity.
3. Spatial relationships (e.g., overlapping symbols) are preserved in discretization but simplified in final categorization.
The agent's prominence in the final output suggests the system may be optimized for scenarios where the agent's actions or perspective are critical (e.g., robotics, autonomous systems). The absence of the + symbol in object maps raises questions about its role—whether it represents noise, a temporary marker, or a category excluded from final analysis.