\n
## Diagram: Image Processing Pipeline - Object Mapping
### Overview
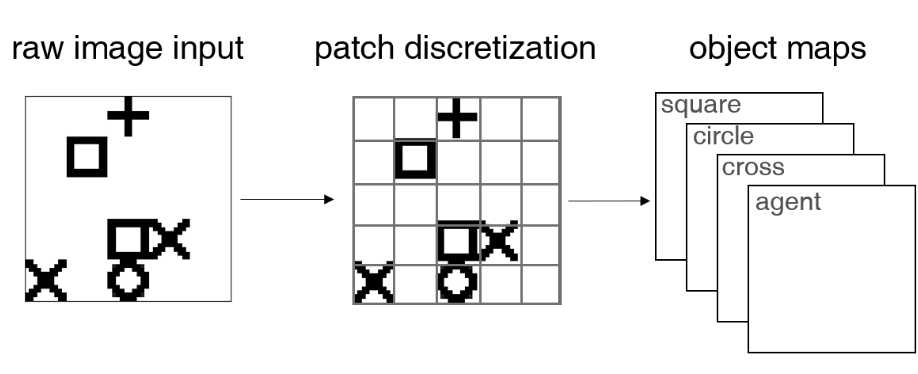
This diagram illustrates a three-stage process for converting a raw image input into object maps. The process involves patch discretization followed by the creation of object maps identifying different shapes within the image.
### Components/Axes
The diagram is divided into three sections, labeled from left to right:
1. **raw image input**: Displays a black and white image containing geometric shapes.
2. **patch discretization**: Shows the same image overlaid with a grid of squares.
3. **object maps**: Presents a stacked bar chart-like representation of object counts.
The shapes present in the raw image are: a plus sign (+), a square (□), a cross (x), and a circle (o).
The object maps section lists the following object types: "square", "circle", "cross", and "agent".
### Detailed Analysis or Content Details
**1. Raw Image Input:**
The image contains four distinct shapes:
- A plus sign (+) located in the top-left quadrant.
- A square (□) positioned below and to the right of the plus sign.
- A cross (x) in the bottom-left quadrant.
- A circle (o) positioned near the cross.
- Another square (□) positioned near the circle and the cross.
**2. Patch Discretization:**
The raw image is overlaid with a grid of approximately 6x6 squares. Each shape falls within one or more grid cells. The grid lines are gray.
**3. Object Maps:**
The object maps are represented as stacked bars. The height of each bar segment corresponds to the number of instances of each object type.
- "square" has two instances, represented by a light gray bar.
- "circle" has one instance, represented by a slightly darker gray bar.
- "cross" has one instance, represented by a darker gray bar.
- "agent" has one instance, represented by the darkest gray bar.
### Key Observations
The diagram demonstrates a process of converting a visual scene into a structured representation of objects. The patch discretization step appears to be a form of spatial quantization, dividing the image into discrete units. The object maps provide a quantitative summary of the objects present in the image. The term "agent" is used, suggesting a potential application in agent-based modeling or simulation.
### Interpretation
This diagram likely represents a simplified pipeline for object recognition or scene understanding. The raw image input is the initial observation. Patch discretization allows for a more manageable representation of the image, potentially simplifying object detection. The object maps then provide a symbolic representation of the scene, counting the occurrences of different object types. The use of "agent" suggests that these objects might represent autonomous entities within a simulated environment. The diagram highlights the transition from a continuous visual input to a discrete, symbolic representation, a common step in many computer vision and artificial intelligence applications. The diagram does not provide any numerical data beyond the counts of each object type.