## Bar Chart: Accuracy of each LLM and PRM combination using Best-of-N on AIME2024
### Overview
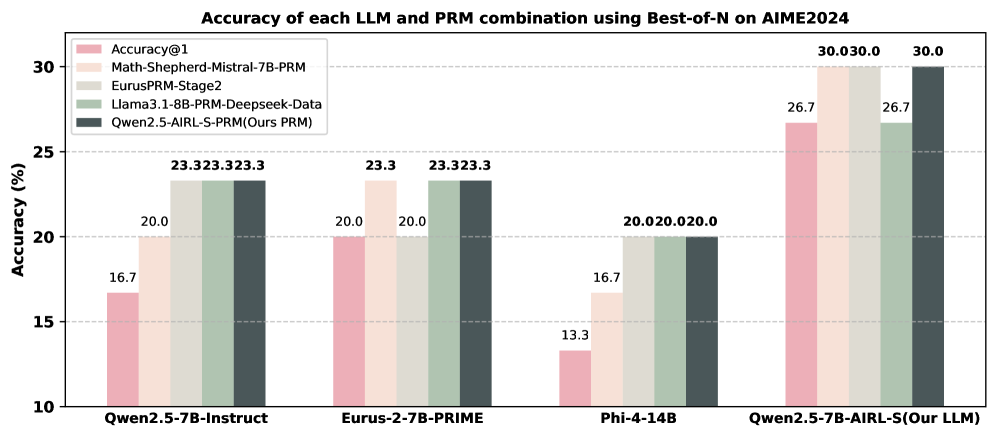
The chart compares the accuracy of five different LLM (Large Language Model) and PRM (Prompt Refinement Method) combinations across four base models (Qwen2.5-7B-Instruct, Eurus-2-7B-PRIME, Phi-4-14B, and Qwen2.5-7B-AIRL-S) on the AIME2024 benchmark. Accuracy is measured in percentage, with values ranging from 10% to 30%.
### Components/Axes
- **X-axis**: Base models (Qwen2.5-7B-Instruct, Eurus-2-7B-PRIME, Phi-4-14B, Qwen2.5-7B-AIRL-S)
- **Y-axis**: Accuracy (%) from 10% to 30%
- **Legend**: Five PRM combinations with color codes:
- Accuracy@1 (pink)
- Math-Shepherd-Mistral-7B-PRM (light orange)
- EurusPRM-Stage2 (light green)
- Llama3.1-8B-PRM-Deepseek-Data (medium green)
- Qwen2.5-AIRL-S-PRM (dark gray)
### Detailed Analysis
1. **Qwen2.5-7B-Instruct**:
- Accuracy@1: 16.7% (pink)
- Math-Shepherd-Mistral-7B-PRM: 20.0% (light orange)
- EurusPRM-Stage2: 23.3% (light green)
- Llama3.1-8B-PRM-Deepseek-Data: 23.3% (medium green)
- Qwen2.5-AIRL-S-PRM: 23.3% (dark gray)
2. **Eurus-2-7B-PRIME**:
- Accuracy@1: 20.0% (pink)
- Math-Shepherd-Mistral-7B-PRM: 23.3% (light orange)
- EurusPRM-Stage2: 23.3% (light green)
- Llama3.1-8B-PRM-Deepseek-Data: 23.3% (medium green)
- Qwen2.5-AIRL-S-PRM: 23.3% (dark gray)
3. **Phi-4-14B**:
- Accuracy@1: 13.3% (pink)
- Math-Shepherd-Mistral-7B-PRM: 16.7% (light orange)
- EurusPRM-Stage2: 20.0% (light green)
- Llama3.1-8B-PRM-Deepseek-Data: 20.0% (medium green)
- Qwen2.5-AIRL-S-PRM: 20.0% (dark gray)
4. **Qwen2.5-7B-AIRL-S (Our LLM)**:
- Accuracy@1: 26.7% (pink)
- Math-Shepherd-Mistral-7B-PRM: 30.0% (light orange)
- EurusPRM-Stage2: 30.0% (light green)
- Llama3.1-8B-PRM-Deepseek-Data: 26.7% (medium green)
- Qwen2.5-AIRL-S-PRM: 30.0% (dark gray)
### Key Observations
- **Highest Performance**: Qwen2.5-7B-AIRL-S (Our LLM) with Qwen2.5-AIRL-S-PRM achieves the highest accuracy (30.0%) across all metrics.
- **Consistency**: Eurus-2-7B-PRIME and Qwen2.5-7B-Instruct show identical accuracy (23.3%) for three PRM combinations (EurusPRM-Stage2, Llama3.1-8B-PRM-Deepseek-Data, Qwen2.5-AIRL-S-PRM).
- **Lowest Performance**: Phi-4-14B has the lowest Accuracy@1 (13.3%) and only reaches 20.0% with Qwen2.5-AIRL-S-PRM.
- **Accuracy@1 vs. Other Metrics**: Accuracy@1 consistently underperforms compared to other PRM combinations, suggesting it may be a stricter or more specialized metric.
### Interpretation
The data demonstrates that the choice of PRM significantly impacts accuracy, with Qwen2.5-AIRL-S-PRM consistently outperforming other combinations. The Qwen2.5-7B-AIRL-S model (Our LLM) achieves the best results, particularly when paired with its native PRM. This suggests that model-PRM synergy is critical for performance. The lower Accuracy@1 scores across all models indicate that this metric may reflect a narrower or more challenging subset of tasks compared to the broader accuracy measurements. The uniformity in performance for some models (e.g., Eurus-2-7B-PRIME) implies robustness to PRM selection, while Phi-4-14B's lower baseline suggests inherent limitations in its architecture or training data.