\n
## Line Chart: Training Performance Metrics
### Overview
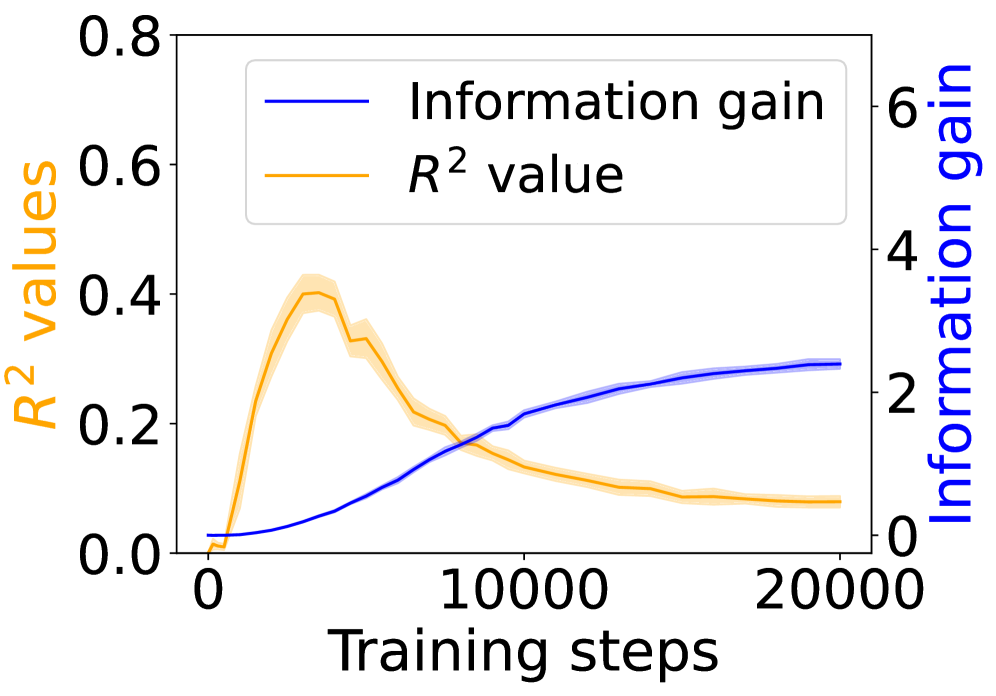
This image presents a line chart illustrating the relationship between training steps and two performance metrics: Information Gain and R² value. The chart tracks these metrics during a training process, likely for a machine learning model. The x-axis represents the number of training steps, while the left y-axis represents the R² value and the right y-axis represents the Information Gain.
### Components/Axes
* **X-axis:** "Training steps" ranging from 0 to approximately 20000.
* **Left Y-axis:** "R² values" ranging from 0.0 to 0.8.
* **Right Y-axis:** "Information gain" ranging from 0 to 6.
* **Legend:** Located in the top-left corner, identifying two data series:
* "Information gain" – represented by a dark blue line.
* "R² value" – represented by an orange line.
### Detailed Analysis
**Information Gain (Dark Blue Line):**
The Information Gain line starts at approximately 0 at 0 training steps. It exhibits a generally upward trend, increasing at a decreasing rate.
* At 0 training steps: ~0.0
* At 5000 training steps: ~1.5
* At 10000 training steps: ~2.0
* At 15000 training steps: ~2.4
* At 20000 training steps: ~2.7
**R² Value (Orange Line):**
The R² value line begins at approximately 0 at 0 training steps. It initially increases rapidly, reaching a peak around 5000 training steps, then gradually declines and plateaus.
* At 0 training steps: ~0.0
* At 2500 training steps: ~0.3
* At 5000 training steps: ~0.43 (peak)
* At 7500 training steps: ~0.35
* At 10000 training steps: ~0.25
* At 15000 training steps: ~0.15
* At 20000 training steps: ~0.1
### Key Observations
* The Information Gain consistently increases with training steps, suggesting the model is continually learning and improving its ability to extract relevant information.
* The R² value initially increases, indicating improved model fit, but then decreases, suggesting overfitting or diminishing returns from further training.
* The peak R² value is significantly higher than the final R² value, indicating that the model performed better earlier in the training process.
* The scales on the y-axes are different, which is important to note when comparing the magnitudes of the two metrics.
### Interpretation
The chart suggests that while the model continues to gain information as training progresses, its ability to generalize to unseen data (as measured by R²) plateaus and eventually declines. This could indicate that the model is starting to overfit the training data. The initial rapid increase in R² followed by a decline is a common pattern in machine learning, and it highlights the importance of monitoring both training performance (Information Gain) and generalization performance (R² value) to determine the optimal stopping point for training. The divergence between the two lines after approximately 7500 training steps is a key indicator that further training may not be beneficial. The model is learning, but not necessarily improving its predictive power on new data. A potential next step would be to implement regularization techniques or early stopping to prevent overfitting and improve the model's generalization ability.