## Bar Chart: Fraction of Tokens vs. Average Accuracy
### Overview
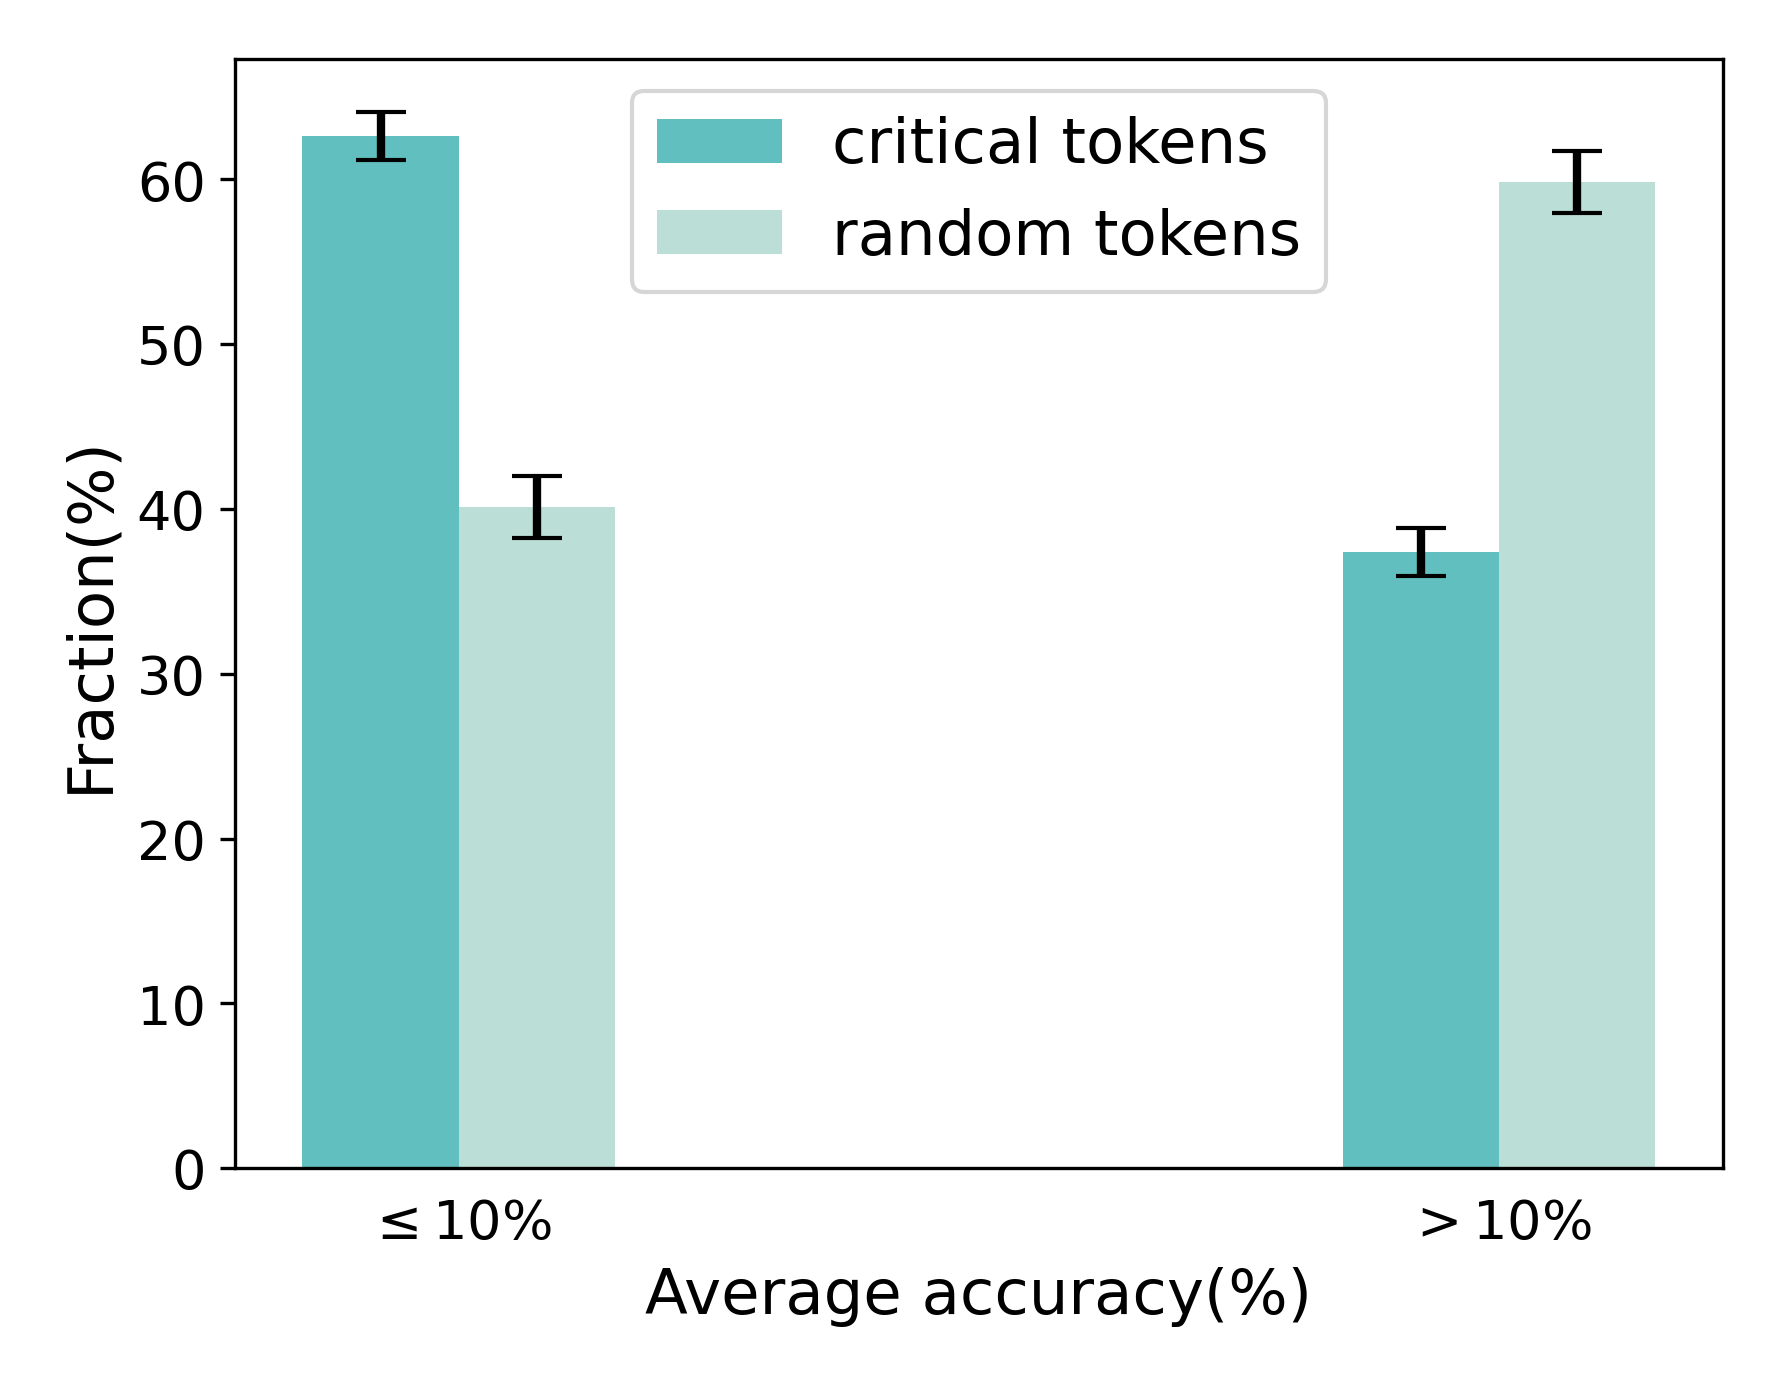
The image is a bar chart comparing the fraction (%) of "critical tokens" and "random tokens" against two categories of average accuracy (≤ 10% and > 10%). Error bars are present on each bar, indicating variability.
### Components/Axes
* **X-axis:** Average accuracy (%), with two categories: "≤ 10%" and "> 10%".
* **Y-axis:** Fraction (%), ranging from 0 to 60. Axis markers are present at intervals of 10 (0, 10, 20, 30, 40, 50, 60).
* **Legend:** Located at the top-right of the chart.
* "critical tokens" (teal)
* "random tokens" (light green)
### Detailed Analysis
* **Category: ≤ 10% Average Accuracy**
* "critical tokens" (teal): Approximately 62% with an error bar extending from approximately 61% to 64%.
* "random tokens" (light green): Approximately 40% with an error bar extending from approximately 39% to 42%.
* **Category: > 10% Average Accuracy**
* "critical tokens" (teal): Approximately 37% with an error bar extending from approximately 36% to 38%.
* "random tokens" (light green): Approximately 60% with an error bar extending from approximately 59% to 62%.
### Key Observations
* For average accuracy ≤ 10%, "critical tokens" have a higher fraction than "random tokens".
* For average accuracy > 10%, "random tokens" have a higher fraction than "critical tokens".
* The fraction of "critical tokens" decreases as average accuracy increases.
* The fraction of "random tokens" increases as average accuracy increases.
### Interpretation
The chart suggests an inverse relationship between the fraction of "critical tokens" and "random tokens" and the average accuracy. When the average accuracy is low (≤ 10%), "critical tokens" are more prevalent. Conversely, when the average accuracy is high (> 10%), "random tokens" are more prevalent. This could indicate that "critical tokens" are more important for lower accuracy scenarios, while "random tokens" become more influential as accuracy improves. The error bars provide a sense of the variability in the data, suggesting that these trends are reasonably consistent.