## Scatter Plot: Language Model Performance vs. Energy Consumption
### Overview
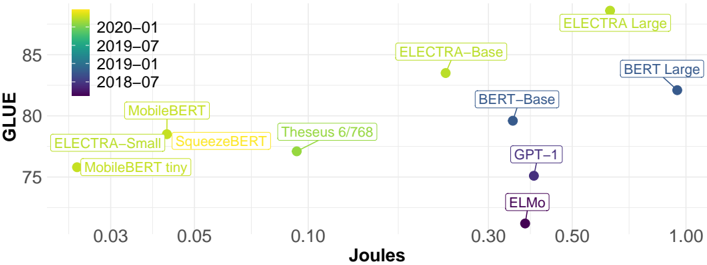
This image is a scatter plot comparing various natural language processing (NLP) models. It plots model performance on the GLUE benchmark (y-axis) against energy consumption measured in Joules (x-axis, logarithmic scale). Data points are color-coded by the model's publication or release date, as indicated by a legend.
### Components/Axes
* **Chart Type:** Scatter plot with labeled data points.
* **Y-Axis:** Labeled "GLUE". Scale is linear, ranging from approximately 75 to above 85. Major tick marks are at 75, 80, and 85.
* **X-Axis:** Labeled "Joules". Scale is logarithmic. Major tick marks are at 0.03, 0.05, 0.10, 0.30, 0.50, and 1.00.
* **Legend:** Located in the top-left corner. It maps point colors to time periods:
* Yellow: 2020-01
* Light Green: 2019-07
* Dark Green: 2019-01
* Dark Purple/Blue: 2018-07
* **Data Points:** Each point represents a specific model, labeled with its name. The points are distributed across the plot area.
### Detailed Analysis
**Data Series & Points (Approximate Values):**
The following table lists each model, its approximate position, and the corresponding color/time period from the legend.
| Model Name | Approx. GLUE Score | Approx. Joules | Color (Time Period) | Spatial Position (Relative) |
| :--- | :--- | :--- | :--- | :--- |
| ELECTRA Large | ~87 | ~0.70 | Yellow (2020-01) | Top-right |
| BERT Large | ~82 | ~1.00 | Dark Blue (2018-07) | Far right, mid-height |
| ELECTRA Base | ~84 | ~0.25 | Yellow (2020-01) | Upper-middle |
| BERT Base | ~80 | ~0.35 | Dark Blue (2018-07) | Center-right |
| GPT-1 | ~76 | ~0.40 | Dark Purple (2018-07) | Lower-right |
| ELMo | ~73 | ~0.35 | Dark Purple (2018-07) | Bottom-right |
| Theseus 6/768 | ~77 | ~0.09 | Dark Green (2019-01) | Center-left |
| MobileBERT | ~79 | ~0.04 | Light Green (2019-07) | Upper-left |
| SqueezeBERT | ~78 | ~0.04 | Yellow (2020-01) | Upper-left, near MobileBERT |
| ELECTRA Small | ~78 | ~0.03 | Yellow (2020-01) | Far left, mid-height |
| MobileBERT tiny | ~76 | ~0.02 | Light Green (2019-07) | Far left, lower |
**Trend Verification:**
* **General Trend:** There is a broad, positive correlation between GLUE score and Joules. Models with higher performance (higher on the y-axis) generally consume more energy (further right on the x-axis).
* **Cluster Analysis:**
* **High-Performance Cluster (Top-Right):** Dominated by larger models like ELECTRA Large and BERT Large, published in 2018-07 and 2020-01.
* **Efficiency Cluster (Left Side):** Contains smaller, more recent models (2019-01 to 2020-01) like MobileBERT, SqueezeBERT, and ELECTRA Small, which achieve moderate GLUE scores with significantly lower energy consumption.
* **Outliers:** ELMo and GPT-1 have relatively low GLUE scores for their energy consumption, placing them in the lower-right quadrant.
### Key Observations
1. **Performance-Energy Trade-off:** The plot visually demonstrates a clear trade-off: achieving state-of-the-art GLUE performance (e.g., >85) requires orders of magnitude more energy (~0.7-1.0 Joules) compared to models scoring in the high 70s (~0.02-0.10 Joules).
2. **Temporal Progression:** The color coding reveals a trend over time. The oldest models (2018-07, dark blue/purple) like BERT and ELMo are scattered. The newest models (2020-01, yellow) like the ELECTRA family and SqueezeBERT appear to offer better performance-per-joule, occupying more favorable positions (higher and/or further left).
3. **Model Family Comparison:** The ELECTRA family (Small, Base, Large) shows a clear internal scaling trend: as model size increases, both GLUE score and energy consumption increase substantially.
4. **Efficiency Innovations:** Models like MobileBERT and SqueezeBERT are positioned notably to the left of older models with similar GLUE scores (e.g., MobileBERT vs. GPT-1), indicating architectural improvements for efficiency.
### Interpretation
This chart is a compelling visualization of the **efficiency frontier** in NLP model development as of early 2020. It suggests that research was actively pursuing two parallel goals: pushing the absolute performance ceiling (top-right) and developing architectures that deliver respectable performance at a fraction of the energy cost (left side).
The data implies that raw performance (GLUE score) is not the only metric of importance; energy consumption is a critical practical constraint for deployment. The positioning of the 2020-01 models (yellow) suggests the field was successfully moving the efficiency frontier outward—creating models that are either more powerful for the same energy or equally powerful for much less energy.
The outlier status of earlier models like ELMo and GPT-1 highlights how rapidly the field advanced; by 2019-2020, newer architectures could achieve similar or better performance with vastly improved efficiency. This plot would be crucial for a researcher or engineer deciding which model to use, forcing a direct comparison between performance goals and computational (energy) budget.