\n
## Diagram: Multi-Agent System Paradigms
### Overview
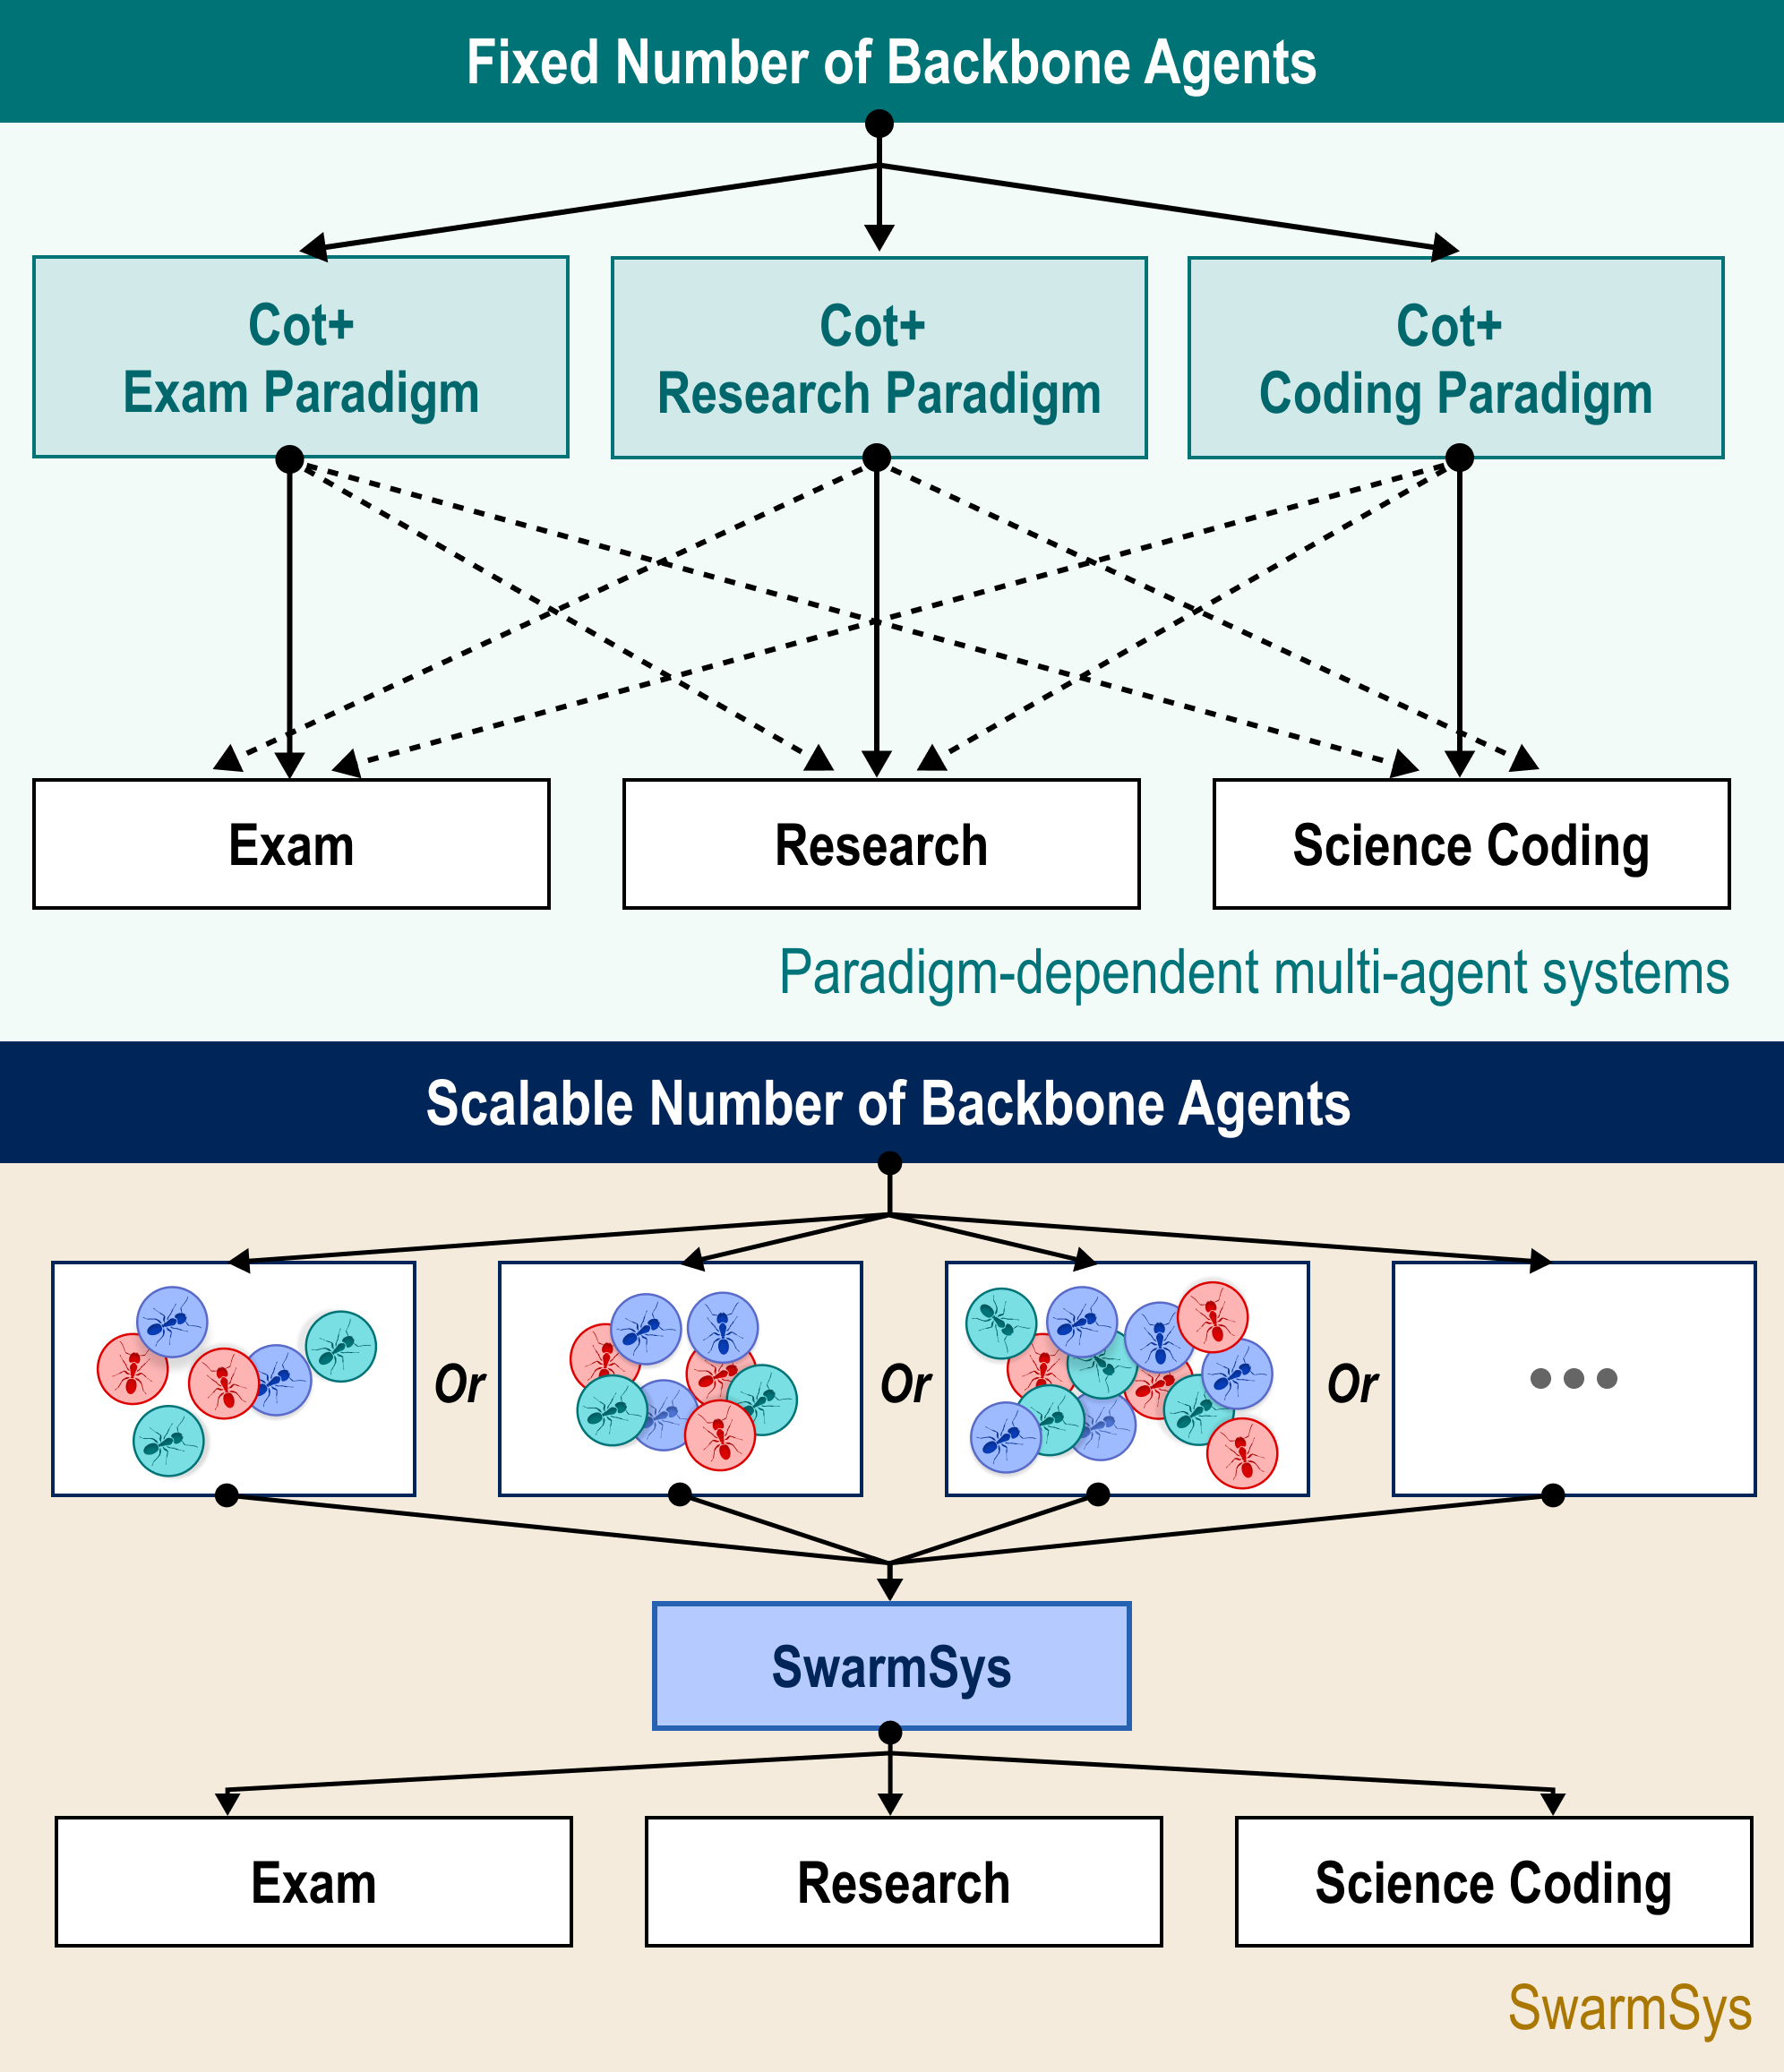
The image presents a diagram illustrating two approaches to multi-agent systems: one with a fixed number of backbone agents and another with a scalable number. The diagram visually represents the relationships between different paradigms (Exam, Research, Coding) and the agents involved in each approach.
### Components/Axes
The diagram is divided into two main sections: "Fixed Number of Backbone Agents" (top) and "Scalable Number of Backbone Agents" (bottom).
**Fixed Number Section:**
* **Title:** "Fixed Number of Backbone Agents" (top-center, teal background)
* **Paradigms:** "Cot+ Exam Paradigm", "Cot+ Research Paradigm", "Cot+ Coding Paradigm" (horizontal row, teal background)
* **Dependent Systems:** "Exam", "Research", "Science Coding" (horizontal row, white background)
* **Label:** "Paradigm-dependent multi-agent systems" (centered below the dependent systems, black text)
* **Arrows:** Dashed arrows connecting each paradigm to each dependent system.
**Scalable Number Section:**
* **Title:** "Scalable Number of Backbone Agents" (bottom-left, light-green background)
* **Agent Clusters:** Three circular clusters, each containing multiple agents (blue circles with red internal shapes). Each cluster is labeled "Or" and has an ellipsis (...) indicating scalability.
* **SwarmSys:** A central box labeled "SwarmSys" (light-green background)
* **Dependent Systems:** "Exam", "Research", "Science Coding" (horizontal row, white background)
* **Arrows:** Solid arrows connecting each agent cluster through "SwarmSys" to each dependent system.
* **Label:** "SwarmSys" (bottom-right, black text)
### Detailed Analysis or Content Details
**Fixed Number Section:**
The diagram shows a fully connected network between the three "Cot+" paradigms and the three dependent systems. Each paradigm is connected to each system via a dashed arrow, indicating a potential interaction or dependency. There are 9 dashed arrows in total.
**Scalable Number Section:**
This section depicts a scalable system where multiple agent clusters (each labeled "Or") feed into a central "SwarmSys" component. "SwarmSys" then distributes the output to the three dependent systems ("Exam", "Research", "Science Coding") via solid arrows. The ellipsis (...) after the third cluster suggests that this pattern can be repeated indefinitely, indicating scalability. Each agent cluster contains approximately 6 agents (blue circles with red internal shapes).
### Key Observations
* The "Fixed Number" approach shows a direct, but potentially limited, connection between paradigms and systems.
* The "Scalable Number" approach introduces a central "SwarmSys" component that acts as an intermediary, enabling scalability and potentially more complex interactions.
* The use of dashed vs. solid arrows suggests a difference in the strength or nature of the relationship between the components in each section. Dashed lines may represent potential or less direct connections, while solid lines represent established or direct connections.
* The agent clusters in the scalable section appear to be composed of two types of agents, represented by the blue circles and the red shapes within them.
### Interpretation
The diagram contrasts two architectural approaches to multi-agent systems. The "Fixed Number" approach represents a more traditional, paradigm-dependent system where each paradigm directly influences each dependent system. This approach may be simpler to implement but lacks scalability and flexibility.
The "Scalable Number" approach, utilizing "SwarmSys", represents a more modern, scalable architecture. The central "SwarmSys" component allows for a dynamic and adaptable system where multiple agent clusters can contribute to the overall functionality. This approach is more complex but offers greater scalability and resilience.
The diagram suggests that the choice between these two approaches depends on the specific requirements of the application. If scalability and adaptability are critical, the "Scalable Number" approach is preferred. If simplicity and direct control are more important, the "Fixed Number" approach may be sufficient. The use of "Cot+" paradigms suggests a focus on Chain-of-Thought reasoning within these systems. The red shapes within the blue agent circles could represent specialized agents or internal states within the agents. The diagram does not provide any quantitative data, but rather a qualitative comparison of two system architectures.