## Bar Chart: Chameleon+ Accuracy vs. Confidence
### Overview
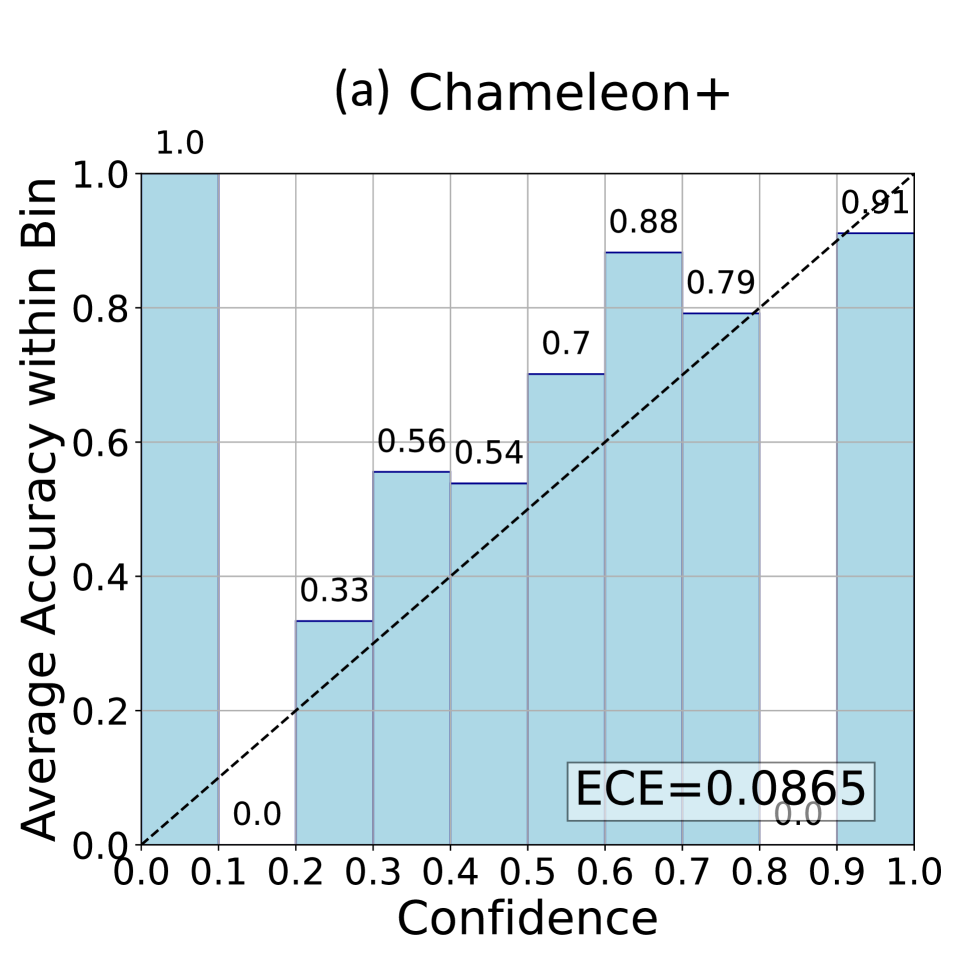
The image is a bar chart titled "(a) Chameleon+" that plots the average accuracy within a bin against confidence. The chart includes a dashed diagonal line representing perfect calibration. The bars, colored light blue, represent the average accuracy for each confidence bin. The Expected Calibration Error (ECE) is also displayed.
### Components/Axes
* **Title:** (a) Chameleon+
* **X-axis:** Confidence, ranging from 0.0 to 1.0 in increments of 0.1.
* **Y-axis:** Average Accuracy within Bin, ranging from 0.0 to 1.0 in increments of 0.2.
* **Bars:** Light blue bars representing the average accuracy for each confidence bin.
* **Diagonal Line:** A dashed black line representing perfect calibration (accuracy = confidence).
* **ECE Value:** ECE = 0.0865, displayed in a white box.
### Detailed Analysis
The chart displays the average accuracy within each confidence bin. The confidence bins are 0.0-0.1, 0.1-0.2, 0.2-0.3, 0.3-0.4, 0.4-0.5, 0.5-0.6, 0.6-0.7, 0.7-0.8, 0.8-0.9, and 0.9-1.0.
Here's a breakdown of the average accuracy for each confidence bin:
* **0.0-0.1:** Accuracy = 1.0
* **0.1-0.2:** Accuracy = 0.0
* **0.2-0.3:** Accuracy = 0.33
* **0.3-0.4:** Accuracy = 0.56
* **0.4-0.5:** Accuracy = 0.54
* **0.5-0.6:** Accuracy = 0.7
* **0.6-0.7:** Accuracy = 0.88
* **0.7-0.8:** Accuracy = 0.79
* **0.8-0.9:** Accuracy = 0.0
* **0.9-1.0:** Accuracy = 0.91
The dashed diagonal line represents perfect calibration, where the accuracy equals the confidence.
### Key Observations
* The model appears to be well-calibrated for high confidence predictions (0.9-1.0), as the accuracy (0.91) is close to the confidence.
* The model is poorly calibrated for low confidence predictions (0.1-0.2 and 0.8-0.9), as the accuracy (0.0) deviates significantly from the confidence.
* The ECE value is 0.0865, which quantifies the overall calibration error.
### Interpretation
The chart visualizes the calibration of the Chameleon+ model. Calibration refers to the alignment between the predicted confidence and the actual accuracy of the model. A perfectly calibrated model would have its accuracy match its confidence across all bins, resulting in points lying on the diagonal line.
The Chameleon+ model shows varying degrees of calibration across different confidence levels. The model is relatively well-calibrated for high confidence predictions, but poorly calibrated for low confidence predictions. The ECE value provides a single metric to quantify the overall calibration error. A lower ECE value indicates better calibration. The ECE of 0.0865 suggests that, on average, the model's confidence is about 8.65% different from its actual accuracy.