## Diagram: Network Graph
### Overview
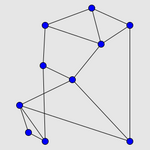
The image depicts a network graph consisting of nodes (represented by blue circles) connected by edges (represented by black lines). The graph appears to be undirected and unweighted. The nodes are arranged in a somewhat irregular pattern.
### Components/Axes
* **Nodes:** Represented by blue circles.
* **Edges:** Represented by black lines connecting the nodes.
* **Background:** Light gray.
### Detailed Analysis
The graph consists of 12 nodes. The connectivity between the nodes varies. Some nodes have a high degree (connected to many other nodes), while others have a low degree.
* **Node 1 (bottom-left):** Connected to 2 other nodes.
* **Node 2 (below Node 1):** Connected to 2 other nodes.
* **Node 3 (left of Node 1):** Connected to 3 other nodes.
* **Node 4 (above Node 3):** Connected to 2 other nodes.
* **Node 5 (center):** Connected to 4 other nodes.
* **Node 6 (top-left):** Connected to 3 other nodes.
* **Node 7 (top):** Connected to 3 other nodes.
* **Node 8 (top-right):** Connected to 3 other nodes.
* **Node 9 (right of Node 7):** Connected to 2 other nodes.
* **Node 10 (bottom-right):** Connected to 2 other nodes.
* **Node 11 (above Node 5):** Connected to 2 other nodes.
* **Node 12 (above Node 6):** Connected to 2 other nodes.
### Key Observations
* The graph is not fully connected, meaning there are nodes that cannot be reached from other nodes without traversing multiple edges.
* The node in the center (Node 5) appears to be a central hub, connecting to several other nodes.
* There is a cluster of nodes in the bottom-left corner (Nodes 1, 2, and 3) that are highly interconnected.
### Interpretation
The network graph visually represents relationships or connections between different entities. The specific meaning of the nodes and edges depends on the context in which the graph is used. For example, the nodes could represent people, and the edges could represent friendships. Or, the nodes could represent computers, and the edges could represent network connections. The structure of the graph reveals patterns of connectivity and influence within the network. The central hub (Node 5) could represent a key influencer or a critical infrastructure component. The clustered nodes in the bottom-left corner could represent a close-knit group or a highly integrated system.