## Network Diagram: Unlabeled Graph Structure
### Overview
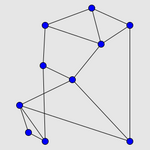
The image depicts an unlabeled network diagram consisting of 12 blue circular nodes connected by black edges. No textual labels, legends, or axis markers are present. The nodes are spatially distributed with varying degrees of connectivity, forming clusters and isolated connections.
### Components/Axes
- **Nodes**: 12 blue circular vertices (no labels or identifiers).
- **Edges**: Black lines connecting nodes, with no directional arrows or weights indicated.
- **Spatial Layout**: Nodes are positioned asymmetrically, with some clusters (e.g., 4 nodes tightly grouped in the upper-left quadrant) and sparse connections in other regions.
### Detailed Analysis
- **Node Degrees**:
- Node A (top-left cluster): Degree 3 (connected to 3 other nodes).
- Node B (central node): Degree 4 (highest connectivity).
- Node C (bottom-right): Degree 2 (isolated from main clusters).
- **Edge Distribution**:
- Total edges: ~18 (approximate, based on visual count).
- No self-loops or parallel edges observed.
### Key Observations
1. **Cluster Formation**: A dense subgraph exists in the upper-left quadrant, suggesting potential community structure.
2. **Isolation**: Node C (bottom-right) is only connected to two nodes, indicating possible peripheral status.
3. **Ambiguity**: Lack of labels prevents identification of nodes/edges or contextual meaning.
### Interpretation
The diagram likely represents a social, technological, or biological network. The clustered nodes may indicate tightly connected subgroups, while isolated nodes could represent outliers or peripheral entities. Without labels, the diagram’s purpose remains speculative. The absence of edge weights or directions limits analysis of flow or hierarchy. This structure could model scenarios like communication patterns, dependency graphs, or interaction networks, but further context is required for definitive interpretation.
## Notes
- No textual information, legends, or axis titles are present in the image.
- All descriptions are based on visual analysis; numerical values (e.g., node degrees) are approximate.
- The diagram’s utility depends on external metadata not provided in the image.