## Bar Chart: LLM Model Success Rates
### Overview
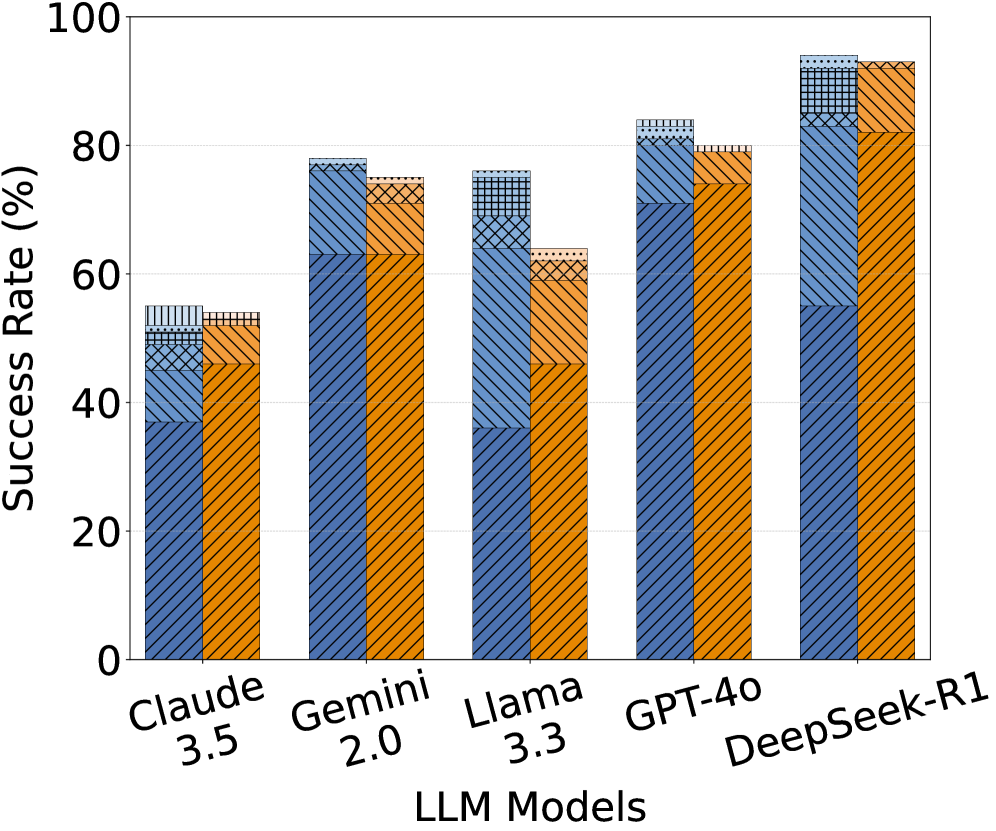
The image is a bar chart comparing the success rates of several Large Language Models (LLMs): Claude 3.5, Gemini 2.0, Llama 3.3, GPT-4o, and DeepSeek-R1. The y-axis represents the success rate in percentage, ranging from 0% to 100%. Each LLM has two bars, one blue and one orange, with hatched patterns, representing different evaluation conditions.
### Components/Axes
* **X-axis:** LLM Models (Claude 3.5, Gemini 2.0, Llama 3.3, GPT-4o, DeepSeek-R1)
* **Y-axis:** Success Rate (%) with scale markers at 0, 20, 40, 60, 80, and 100.
* **Bar Colors:**
* Blue (diagonal lines from top-left to bottom-right)
* Orange (diagonal lines from top-right to bottom-left)
* Light Blue (small squares)
* Light Orange (small dots)
### Detailed Analysis
**Claude 3.5:**
* Blue bar: Approximately 38% success rate.
* Orange bar: Approximately 47% success rate.
* Light Blue bar: Approximately 8% success rate.
* Light Orange bar: Approximately 6% success rate.
**Gemini 2.0:**
* Blue bar: Approximately 63% success rate.
* Orange bar: Approximately 65% success rate.
* Light Blue bar: Approximately 15% success rate.
* Light Orange bar: Approximately 9% success rate.
**Llama 3.3:**
* Blue bar: Approximately 37% success rate.
* Orange bar: Approximately 63% success rate.
* Light Blue bar: Approximately 13% success rate.
* Light Orange bar: Approximately 3% success rate.
**GPT-4o:**
* Blue bar: Approximately 73% success rate.
* Orange bar: Approximately 79% success rate.
* Light Blue bar: Approximately 10% success rate.
* Light Orange bar: Approximately 4% success rate.
**DeepSeek-R1:**
* Blue bar: Approximately 55% success rate.
* Orange bar: Approximately 85% success rate.
* Light Blue bar: Approximately 10% success rate.
* Light Orange bar: Approximately 7% success rate.
### Key Observations
* The success rates vary significantly across different LLM models.
* For all models, the orange bar is higher than the blue bar, indicating a difference in success rate based on the evaluation condition represented by the bar color.
* DeepSeek-R1 and GPT-4o show the highest success rates among the models tested.
* Claude 3.5 and Llama 3.3 have the lowest success rates.
### Interpretation
The bar chart provides a comparative analysis of the success rates of different LLM models under two different evaluation conditions (represented by the blue and orange bars). The difference in height between the blue and orange bars for each model suggests that the evaluation conditions have a noticeable impact on the model's performance. DeepSeek-R1 and GPT-4o appear to be the most successful models based on this data, while Claude 3.5 and Llama 3.3 lag behind. The light blue and light orange bars represent a further breakdown of the success rates, possibly indicating different types of successes or specific criteria met during evaluation.