\n
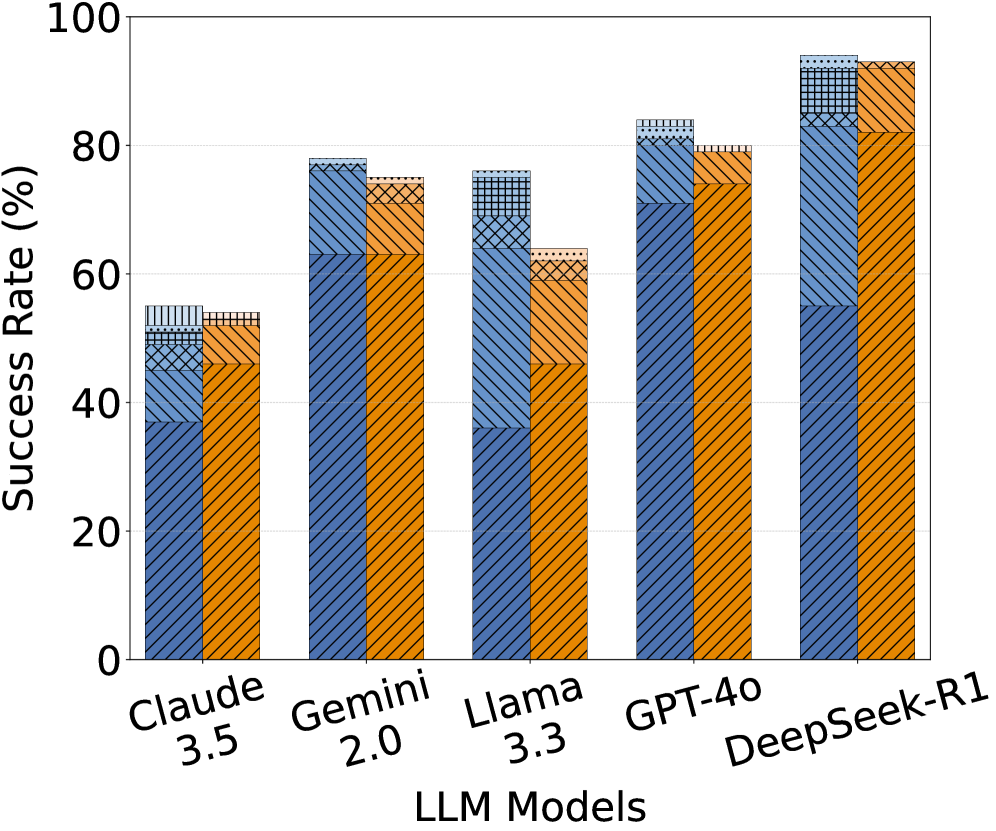
## Bar Chart: LLM Success Rates
### Overview
This is a grouped bar chart comparing the success rates of five different Large Language Models (LLMs) – Claude 3.5, Gemini 2.0, Llama 3.3, GPT-4.0, and DeepSeek-R1. Each LLM has three bars representing different conditions or categories, indicated by different patterns within the bars. The y-axis represents the success rate in percentage, ranging from 0 to 100, while the x-axis lists the LLM models.
### Components/Axes
* **X-axis Label:** "LLM Models"
* **Y-axis Label:** "Success Rate (%)"
* **LLM Models (Categories):** Claude 3.5, Gemini 2.0, Llama 3.3, GPT-4.0, DeepSeek-R1
* **Bar Patterns (Sub-categories):** Three distinct patterns are used to differentiate the conditions. Let's label them as Pattern A (solid blue), Pattern B (diagonal stripes), and Pattern C (cross-hatch).
* **Legend:** There is no explicit legend, but the patterns within the bars represent different conditions.
### Detailed Analysis
Let's analyze each LLM's success rates for each pattern:
* **Claude 3.5:**
* Pattern A (solid blue): Approximately 50%
* Pattern B (diagonal stripes): Approximately 55%
* Pattern C (cross-hatch): Approximately 58%
* **Gemini 2.0:**
* Pattern A (solid blue): Approximately 65%
* Pattern B (diagonal stripes): Approximately 72%
* Pattern C (cross-hatch): Approximately 75%
* **Llama 3.3:**
* Pattern A (solid blue): Approximately 60%
* Pattern B (diagonal stripes): Approximately 68%
* Pattern C (cross-hatch): Approximately 70%
* **GPT-4.0:**
* Pattern A (solid blue): Approximately 75%
* Pattern B (diagonal stripes): Approximately 80%
* Pattern C (cross-hatch): Approximately 82%
* **DeepSeek-R1:**
* Pattern A (solid blue): Approximately 70%
* Pattern B (diagonal stripes): Approximately 85%
* Pattern C (cross-hatch): Approximately 90%
**Trends:**
* For all LLMs, the success rate generally increases from Pattern A to Pattern C.
* GPT-4.0 and DeepSeek-R1 consistently demonstrate higher success rates across all patterns compared to Claude 3.5, Gemini 2.0, and Llama 3.3.
* DeepSeek-R1 shows the most significant improvement from Pattern A to Pattern C.
### Key Observations
* DeepSeek-R1 consistently outperforms other models, especially in Pattern C, achieving a success rate close to 90%.
* Claude 3.5 has the lowest success rates across all patterns.
* The difference in success rates between Pattern A and Pattern C is more pronounced for GPT-4.0 and DeepSeek-R1.
### Interpretation
The chart demonstrates the performance of different LLMs under varying conditions (represented by the three patterns). The increasing success rate from Pattern A to Pattern C suggests that the conditions represented by Pattern C are more favorable for these models. GPT-4.0 and DeepSeek-R1 are the most robust models, consistently achieving high success rates regardless of the condition. Claude 3.5 appears to be the least capable model in this comparison.
The lack of a legend makes it difficult to determine what the different patterns represent. However, the consistent trend of increasing success rates with Pattern C suggests that this condition might involve simpler tasks, more training data, or a more suitable input format. The chart highlights the varying capabilities of different LLMs and the importance of considering the specific conditions when evaluating their performance. Further investigation is needed to understand the meaning of the patterns and the factors contributing to the observed differences in success rates.