## Grouped Bar Chart: LLM Model Success Rate Comparison
### Overview
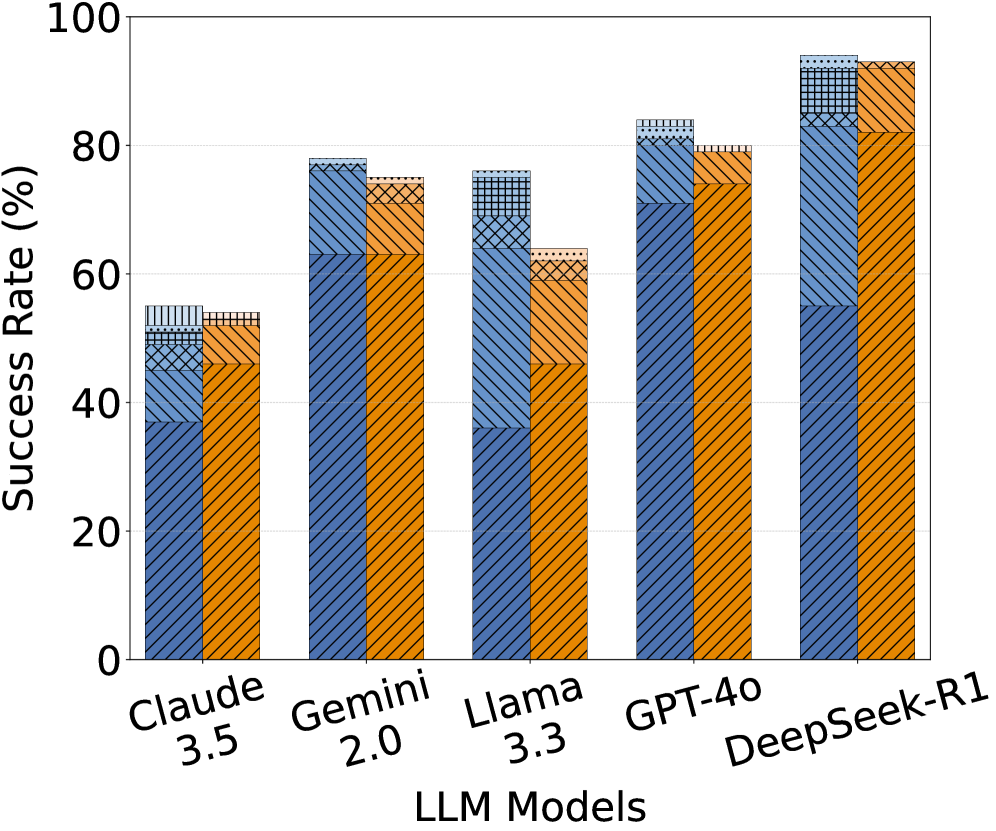
The image displays a grouped bar chart comparing the success rates (in percentage) of five different Large Language Model (LLM) models. Each model has two adjacent bars, one blue and one orange, each segmented into multiple patterned sections. The chart is presented on a white background with a simple black border.
### Components/Axes
* **X-Axis (Horizontal):** Labeled "LLM Models". It lists five models from left to right:
1. Claude 3.5
2. Gemini 2.0
3. Llama 3.3
4. GPT-4o
5. DeepSeek-R1
* **Y-Axis (Vertical):** Labeled "Success Rate (%)". The scale runs from 0 to 100, with major tick marks and numerical labels at intervals of 20 (0, 20, 40, 60, 80, 100).
* **Data Series:** For each model, there are two bars:
* **Left Bar (Blue):** Features a diagonal line pattern (`///`).
* **Right Bar (Orange):** Features a diagonal line pattern in the opposite direction (`\\\`).
* **Bar Segmentation:** Each bar is divided into 3-4 distinct segments, differentiated by fill patterns. The patterns observed are:
* Diagonal lines (primary fill for the main bar body).
* Cross-hatching (`XXX`).
* Grid/checkered pattern.
* Dotted pattern (appears only at the very top of some bars).
* **Legend:** **No legend is present in the image.** The meaning of the different bar colors (blue vs. orange) and the internal segmentation patterns is not defined.
### Detailed Analysis
**Trend Verification & Spatial Grounding:**
The overall trend shows an increase in success rate from left to right, with DeepSeek-R1 achieving the highest values. For each model, the blue and orange bars are of very similar total height, suggesting comparable overall performance between the two measured conditions (whatever they represent).
**Approximate Values by Model (Total Bar Height):**
* **Claude 3.5:**
* Blue Bar: ~55% (Segments: ~38% diagonal, ~10% cross-hatch, ~7% grid).
* Orange Bar: ~54% (Segments: ~52% diagonal, ~2% grid at top).
* **Gemini 2.0:**
* Blue Bar: ~78% (Segments: ~63% diagonal, ~15% cross-hatch).
* Orange Bar: ~75% (Segments: ~63% diagonal, ~12% cross-hatch).
* **Llama 3.3:**
* Blue Bar: ~76% (Segments: ~36% diagonal, ~33% cross-hatch, ~7% grid).
* Orange Bar: ~64% (Segments: ~46% diagonal, ~18% cross-hatch).
* **GPT-4o:**
* Blue Bar: ~84% (Segments: ~71% diagonal, ~13% cross-hatch).
* Orange Bar: ~80% (Segments: ~75% diagonal, ~5% grid).
* **DeepSeek-R1:**
* Blue Bar: ~94% (Segments: ~55% diagonal, ~30% cross-hatch, ~9% grid).
* Orange Bar: ~93% (Segments: ~82% diagonal, ~11% cross-hatch).
**Segment Pattern Observations:**
The cross-hatch pattern is a significant component in the blue bars for Gemini 2.0, Llama 3.3, and DeepSeek-R1. The grid pattern appears as a smaller top segment in several bars (Claude 3.5 blue, Llama 3.3 blue, GPT-4o orange, DeepSeek-R1 blue). The dotted pattern is only visible as a very thin cap on the DeepSeek-R1 blue bar.
### Key Observations
1. **Performance Hierarchy:** DeepSeek-R1 > GPT-4o > Gemini 2.0 ≈ Llama 3.3 (blue) > Claude 3.5. Llama 3.3's orange bar is notably lower than its blue bar and the other models' performances.
2. **Internal Composition Variance:** While total heights are similar for blue/orange pairs within a model, the internal segmentation differs. For example, Llama 3.3's blue bar has a large cross-hatch segment (~33%), while its orange bar has a much smaller one (~18%).
3. **Missing Context:** The most critical missing information is the legend. It is impossible to know what the blue vs. orange bars represent (e.g., different prompting techniques, evaluation benchmarks, or task types) or what the internal patterns signify (e.g., sub-categories of success, different error types, or confidence intervals).
### Interpretation
This chart presents a comparative performance benchmark of five prominent LLMs. The data suggests that, on the measured task(s), **DeepSeek-R1 and GPT-4o are the top performers**, with success rates exceeding 80%. Claude 3.5 shows the lowest success rate among this group.
The **key investigative question** raised by this chart concerns the meaning of the dual bars and their segments. The consistent pairing suggests a controlled comparison between two conditions (A/B testing, two methods, etc.). The internal segmentation implies that the "Success Rate" is a composite metric, broken down into constituent parts. For instance, the patterns could represent:
* Different sub-tasks contributing to an overall score.
* Success rates under varying levels of difficulty.
* Breakdowns of correct answers by type (e.g., factual recall, reasoning, creativity).
**Without the legend, the chart's explanatory power is severely limited.** It effectively shows *that* performance differs between models and between the two conditions (blue/orange), but not *why* or *in what specific way*. The notable drop in Llama 3.3's orange bar performance compared to its blue bar is a potential anomaly that would require the missing context to interpret. The chart successfully communicates a ranking but fails to explain the underlying factors driving that ranking.