## Directed Graph Diagram: Node Interconnections
### Overview
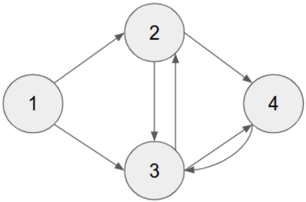
The image depicts a directed graph with four nodes (labeled 1–4) connected by bidirectional and unidirectional edges. Arrows indicate the direction of relationships, with one node (4) containing a self-loop. The graph forms a diamond-like structure with node 2 at the top, node 3 at the bottom, node 1 on the left, and node 4 on the right.
### Components/Axes
- **Nodes**:
- Node 1 (left)
- Node 2 (top)
- Node 3 (bottom)
- Node 4 (right)
- **Edges**:
- Unidirectional:
- 1 → 2 (top-left to top)
- 2 → 3 (top to bottom)
- 3 → 1 (bottom to left)
- 2 → 4 (top to right)
- 4 → 3 (right to bottom)
- Bidirectional:
- 2 ↔ 3 (top ↔ bottom)
- Self-loop:
- 4 → 4 (right node loops to itself)
### Detailed Analysis
- **Node 1**:
- Outgoing edge to Node 2.
- Incoming edge from Node 3.
- **Node 2**:
- Outgoing edges to Nodes 3 and 4.
- Incoming edge from Node 1.
- Bidirectional connection to Node 3.
- **Node 3**:
- Outgoing edges to Nodes 1 and 4.
- Incoming edges from Nodes 2 and 4.
- Bidirectional connection to Node 2.
- **Node 4**:
- Outgoing edges to Node 3 and itself (self-loop).
- Incoming edge from Node 2.
### Key Observations
1. **Cyclic Relationships**:
- A self-loop on Node 4 suggests a feedback mechanism or autoregulation.
- A cycle exists via the path 2 → 3 → 4 → 3 → 2, indicating potential infinite loops in traversal.
2. **Bidirectional Interaction**:
- Nodes 2 and 3 share a mutual connection, implying a two-way relationship (e.g., mutual dependency or exchange).
3. **Asymmetry**:
- Node 1 has only one incoming edge (from Node 3) and one outgoing edge (to Node 2), making it a "leaf" node in the graph.
4. **Central Hub**:
- Node 2 acts as a central hub with three outgoing edges (to 3, 4, and itself via Node 3) and one incoming edge.
### Interpretation
This graph likely represents a network where nodes are entities (e.g., processes, systems, or actors) and edges are directional relationships (e.g., data flow, dependencies, or interactions). The self-loop on Node 4 suggests a feedback mechanism, while the bidirectional edge between Nodes 2 and 3 implies mutual influence. The absence of numerical labels or weights on edges indicates the diagram focuses on structural relationships rather than quantitative metrics. The diamond-like layout emphasizes Node 2 as a central coordinator, with Node 1 serving as a peripheral node. The cycle involving Nodes 2, 3, and 4 could represent a closed-loop system requiring careful analysis to avoid infinite recursion in computational contexts.