\n
## Diagram: Directed Graph with Four Nodes
### Overview
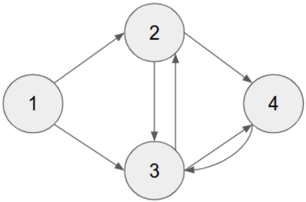
The image depicts a directed graph consisting of four nodes, labeled 1 through 4. Arrows indicate the direction of relationships between these nodes. The diagram appears to represent a state transition diagram or a flow chart.
### Components/Axes
The diagram consists of:
* **Nodes:** Four circular nodes labeled 1, 2, 3, and 4.
* **Edges (Arrows):** Directed arrows connecting the nodes, indicating the flow or relationship between them.
### Detailed Analysis or Content Details
The following connections are present:
* Node 1 -> Node 2
* Node 1 -> Node 3
* Node 2 -> Node 3
* Node 2 -> Node 4
* Node 3 -> Node 4
* Node 4 -> Node 3
There are no labels on the edges, and no other textual information is present. The nodes are arranged roughly in a diamond shape. Node 1 is positioned on the left, Node 2 at the top, Node 3 at the bottom, and Node 4 on the right.
### Key Observations
The graph is strongly connected, meaning there is a path between any two nodes. Node 4 has a self-loop, pointing back to Node 3. Node 3 is a destination for multiple edges, suggesting it might be a common state or a sink.
### Interpretation
This diagram likely represents a system with four states (1, 2, 3, and 4) and defined transitions between them. The arrows indicate the possible state changes. The loop from Node 4 to Node 3 suggests a recurring process or a state that can return to a previous state. Without additional context, it's difficult to determine the specific meaning of the states and transitions. It could represent a finite state machine, a workflow, or a dependency graph. The absence of edge labels makes it impossible to understand the conditions or events that trigger the transitions.